It’s like déjà vu all over again.
Last month, significant outflows across the global ETF industry caused more than a few dramatic headlines. But pundits had barely finished analyzing the month’s hemorrhage when flows started to turn around, and sharply at that. While it’s too soon to tell whether the current snapback is here to stay, it does nicely illustrate the whiplash involved in covering ETF flow news.
In total, ETFs in June lost a total of $8.2 billion – the first month of outflows since November 2011 (which were very minimal), and the first month of fixed income ETF outflows since December 2010. But through July 18, global ETFs rebounded to the tune of $34 billion in new inflows. [ETF Buying Spree in July]
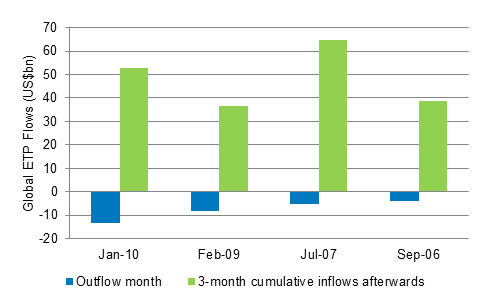
So what’s causing this sudden (and drastic) change of heart – again? In order to answer this question, we thought it would be interesting to look back at other times when ETFs experienced dramatic outflows. As you can see in the chart below, there have been four periods of outflows of more than $2 billion going back to 2006 (excluding last month).
In all cases, one month of outflows was followed by three months of pretty significant inflows. Also of note is the fact that equities led the outflows as well as the subsequent inflows in all of these scenarios. This isn’t a huge surprise, given the fact that equity ETFs make up a majority of the industry at 75%.
And based on our data, when investors got back into the market after a month of outflows, they showed a preference for US equity ETFs – and July has been no exception. Of the $34 billion that came in as of July 18, 81% was invested in the US equity category, with investors buying ETFs holding large cap companies as well as those that track the energy, technology and financial sectors.
As always, past flow patterns are certainly no indication of future flow patterns, and it’s too soon to tell whether the latest turnaround is here to stay. But I think that looking at this can help put periods of ETF outflows in perspective. And it should be noted that ETF outflows aren’t necessarily triggered by major market selloffs. Take 2008 when ETF flows hit $260 billion as the S&P 500 tanked 38%.
So despite some bumps in the road, the growth trajectory for these products has been enormous, (over $2 trillion in total assets), and doesn’t look to be slowing down any time soon. By our calculation, US ETF assets could more than double over the next five years, reaching $3.5 trillion.
Dodd Kittsley, CFA, is the Head of Global ETP Market Trends Research for BlackRock.