Relative strength analysis pits one asset against the other (in this case one ETF vs. the S&P 500) to determine which one is the better performer. Many classical technical devices can be used in the same manner as they are used on price charts.
These studies are also invaluable in portfolio analysis as they can guide you to where money should be over or under allocated.
With that said, there are two key takeaways from this report: the first is that despite bounces in relative strength in the international/emerging market ETFs highlighted the dominant trend favors the S&P 500 as evident by the technical breakouts; the second is that within the S&P 500, it appears that PowerShares QQQ Trust ETF (QQQ) has become a leadership sector.
Investing in the strongest global equity markets will save you a lot of headaches.
PowerShares QQQ (QQQ): A positive outside month in April 2013 was followed by a key relative strength breakout. The rally began to pick up speed in May 2013 as QQQ surpassed its September 2012 high and set into motion the resumption of the 2009 uptrend. This now opens the door for a move closer to 80-82 or the top of the 2009 uptrend channel and the 61.8% Fibonacci retracement of the 2000-2002 decline. On the other hand the 12% April-May 2013 rally resulted in an overbought condition and the 5/24/13 negative outside week suggests a consolidation first.
iShares MSCI EAFE ETF (EFA): EFA has fallen below the April 2013 breakout, relative to the S&P 500. This is what is classified as a false breakout and they can be taken advantage as well. As anticipated this has since led to the resumption of its underperformance cycle. From an absolute perspective the 5/22/13 negative outside day, the 5/23/13 downside gap, the5/24/13 negative outside week, and a potential bearish flag formation are pointing towards lower prices. The top of the gap (62.70) will now act initial resistance.
iShares FTSE China Large-Cap ETF (FXI): The ability to hold onto the extension of the top of the 2010 symmetrical triangle pattern has led to some kind of technical oversold rally. However, the rally looks to have stalled as a large 5/24/13 negative outside week pattern has developed, which is warning of distribution forces at work. Key support remains near 34.50 or the Apr 2013 low as well as the converged apex of the symmetrical triangle pattern. From a relative strength perspective, FXI continues to behave poorly with no technical signs of reversing at this point.
iShares MSCI Emerging Market ETF (EEM): It appears that EEM is headed for a test of key support in the low-40s which corresponds to the 2008 uptrend line. The inability to maintain this support warns of an end to the 2008 uptrend and opens the door for a test of the 38.2% Fibonacci retracement of the 2008-2011 rally. On the other hand, large ascending triangle pattern dating back to 2011 is still developing. A breakout above the top of the pattern near 45 could set into motion the next sustainable rally. The timing of this pattern looks like it could resolve itself in the weeks/months to come.
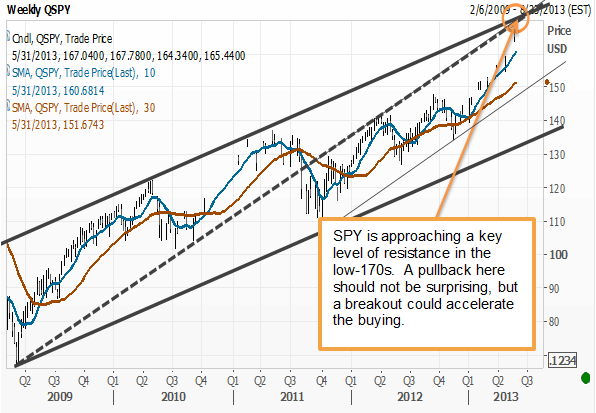
SPDR S&P 500 ETF (SPY): SPY is approaching a key level of resistance in the low-170s which corresponds to the top of the 2009/2011 uptrend channels and the extension of a 2009 uptrend line. A pullback here should not be surprising, but a breakout could result in an accelerated the buying. Initial support is near 160 or the April 2013 high, the May 2013 breakout level, and the 50-day moving average. A violation of this support opens the door for a move towards the September 2012 high and the bottom of the 2011 uptrend channel near 150.
J. Beck Investments is an independent provider of technical research for ETFs.