iShares FTSE China Large-Cap ETF (FXI): There is technical evidence to suggest that FXI may be in the process of a healthy basing effort. For example, FXI is now trading above the top of its Feb. 2013 downtrend channel and it has also broken out of the steep Feb. 2013 relative strength downtrend. A couple of things can now occur to further stabilize the selling: one would be a successful test of the Apr. 2013 low (34.50) and the other would be a move above initial resistance near 37-38 or where a convergence of daily/weekly/month moving averages reside.
iShares MSCI Emerging Market ETF (EEM): There are a couple of things that are showing up on the weekly chart shown that need to be monitored carefully. The first is the technical death cross that has recently developed as the 10-week moving average has crossed below the 30-week moving average. On a stand-alone basis, this is a bearish technical sell signal. The other is this large ascending triangle pattern as EEM recently tested the bottom of the pattern. A violation of support near 40-41 confirms a breakdown and would likely result in a more cautious outlook.
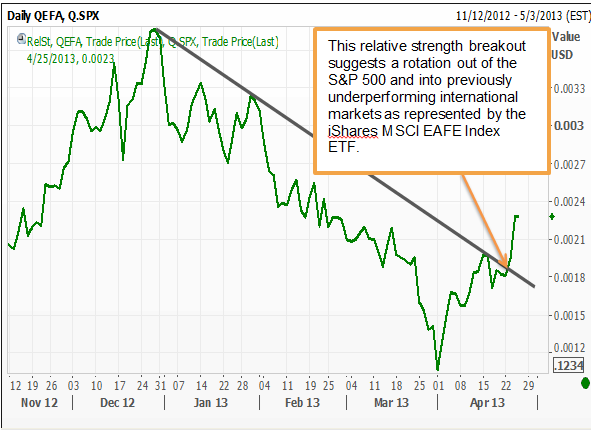
iShares MSCI EAFE ETF (EFA): A Jul. 2012 uptrend channel and the Jan. 2013 ascending triangle breakout are pointing to higher prices in the near-term. However, a violation of the bottom of the channel, currently near 58.50 could alter the bullish outlook. The Jan. 2013 breakout level, closer to 56 provides secondary support. To the upside, initial resistance looks to reside near the Apr. 2013 high (60.84). A move above this supply resolves the sideways trading that has been ongoing this year and allows for a test of the 2011 high (64.35). Relative to SPX, EFA looks to be breaking out from its Dec.
The chart below shows the relative performance of EFA versus the S&P 500.
J. Beck Investments is an independent provider of technical research for ETFs.