In early March 2013, GLD was still in the midst of an extensive high level consolidation (sideways) trading pattern. As these patterns need resolution before any decisive action can be taken, traders/investors were forced to trade within the confines of this pattern until such resolution comes. Betting on a breakout/down without confirmation can prove expensive, so pattern trading is a game of patience. It was expected that this pattern would resolve itself as early as 1H 2013.
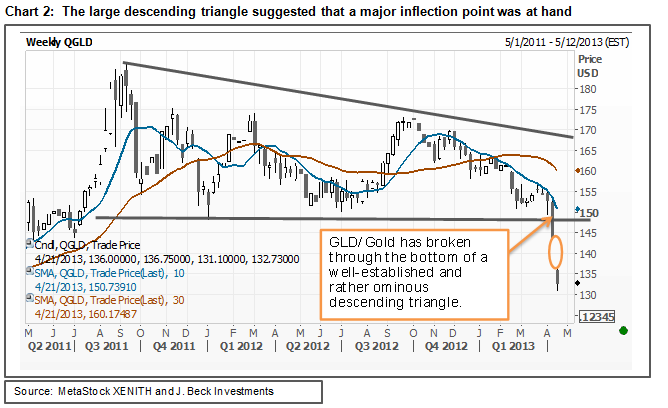
As noted then, however, the line in the sand for GLD/Gold was 148-149/1525 as this was the bottom of this large descending triangle pattern. The height (price) and width (duration) of this pattern was alluding to a major inflection point upon completion. In other words a technical breakout above the top of the pattern pointed to significantly higher prices and a continuation of the intermediate-term uptrend, while a breakdown confirmed a major change in trend.
The line has been crossed, so now what?
GLD/Gold not only crossed the line in the sand, but ran right through it. The question now becomes: how low is low? Well, despite an extreme oversold reading it appears that GLD/Gold is headed lower.
First of all, the 4/15/13 close was near the bottom of the daily range, suggesting that the sellers have not capitulated yet. Secondly, next chart support for GLD/Gold isn’t evident until (127.80-125.92/1296.30-1307.70), which corresponds to the January 2011 pivot low and the 50% Fibonacci retracement of the 2008-2011 rally. In fact, a technical target based on the descending triangle formation as well as the 61.8% Fibonacci retracement suggests that GLD/Gold can go as low as (110.69-111.78/1138.40-1151.10).
On the other hand, the charts are going to require some extensive backing filling once a price bottom is had in order to repair this technical damage. Given the explosive volume over the last couple of days, one would expect formidable supply to be at the top of the GLD/Gold 4/12/13 downside gap (143.43/1480.20) and then the level of breakdown (148-149.65/1525-1540).
The reality of the matter and the conclusion of this report is that GLD/Gold are likely headed lower. Until the technical damage, some of which was discussed above, is repaired, then rallies should be viewed as unsustainable and may be seen as opportunities for the longs to exit positions and the shorts to build theirs. In order to become convinced that a bottom has been put in place, evidence of some kind of base building effort needs to occur to prove that buyers are willing to support prices. Until then be wary of technical bounces.

J. Beck Investments is an independent provider of technical research for ETFs.