International and Emerging ETFs such as iShares MSCI EAFE (NYSEArca: EFA), iShares FTSE China 25 (NYSEArca: FXI) and iShares MSCI Emerging Markets (NYSEArca: EEM) have heavily underperformed now for several months. In fact, the broader trends unveil this underperformance for several years now.
There is one striking difference amongst these ETFs however, which is that EFA has held up relatively well for much of 2013. This should be good news, right? Well, the technical breakdown relative to the S&P 500 this week is a bit concerning, especially as EEM and FXI are bouncing.
Yes, it is too early to call these bounces sustainable, but it may allude to bottom process, while EFA may be in the early stages of some kind of topping formation. Again, it is a bit premature, but a possible head and shoulders top needs to be monitored.
A breakdown in EFA could be accompanied by global money managers reallocating into domestic markets, reinforcing the relative outperformance and artificially elevating these markets to unsustainable levels.
iShares MSCI EAFE ETF (EFA): EFA is resting on trader support near 58.70 or the No. 2012 uptrend line and the 50-day moving average. A violation of this support opens the door for a test of what could prove to be a significant support near 56-57 as this corresponds to the Feb. 2013 low, the Oct. 2011 and Mar. 2012 highs, and the 30-week moving average. To the upside, a move above the Mar. 2013 high (60) confirms some kind of high level accumulation pattern. This helps to negate the 2009 head and shoulders top pattern and opens the door for a move toward the 2011 high (64.35).
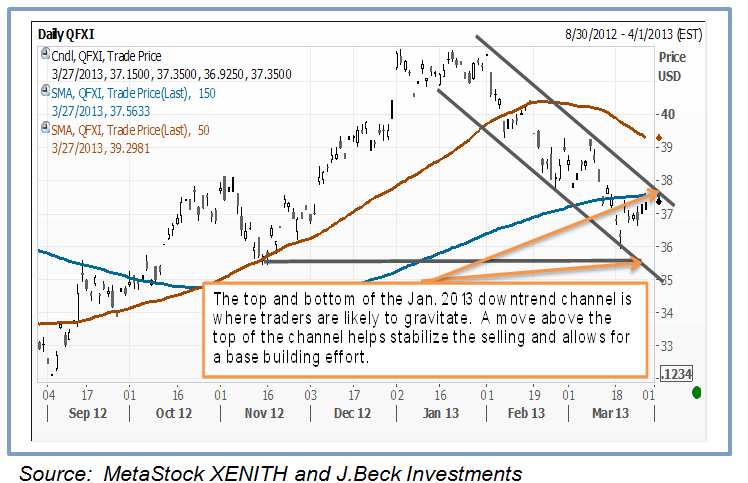
iShares FTSE China 25 (FXI): From a longer-term perspective, the large symmetrical triangle pattern continues to suggests that strength and weakness will alternate between the top and bottom of this pattern. This pattern looks as if it could resolve itself as early as 1H 2013. The near-term picture remains bearish, as FXI trades within a well-established downtrend channel. Traders are likely to gravitate to these levels as a technical guide. A breakout helps to stabilize the selling pressure and allows for a move to initial resistance near 39.25-40.
SPDR S&P 500 ETF (SPY): SPY has worked off a near-term overbought condition that developed as a result of the Feb-Mar.2013 rally (5.10%). However, it will likely take a convincing move above the 2000/2007 highs (155.75/157.52) to trigger a major short squeeze and force sideline money into the market. If that occurs, then how high is high? SPY may go as high as the low-160s to 170 in a speculative type of market before reaching a major market top. Sector rotations may help to signal a peaking market. [Sector ETF Technical Update]
PowerShares QQQ (QQQ): Although the consolidation this month may be constructive, the 3/19 and 3/25 2013 negative outside days warn of distribution forces at work. Over the very near-term (days/weeks), a small trading range is likely to be confined to 67.60-69 or near the Mar. 2013 low and the Mar. 2013 highs. The intermediate to longer-term concern remains the continued weakness in relative strength and the potential yearlong head and shoulders top. Key supports reside at the 2009 trend line (64) and neckline support (60).
iShares MSCI Emerging Market ETF (EEM): A short-term technical oversold rally may develop on the ability to find support near the bottom of the Dec. 2012 downtrend channel. However, keep in mind that the near-term trend remains down and the intermediate to longer term outlook still has a multi-year head and shoulders top pattern to contend with. From a relative strength perspective, domestic equity market ETFs like SPY continue to dramatically outperform. Therefore, for the time being, both relative and absolute rallies need to view with caution and opportunities could be taken to unload weak positions.
iShares FTSE China 25
J. Beck Investments is an independent provider of technical research for ETFs.