With all the fiscal negotiation drama in Washington, interest in municipal securities has been particularly high in the last few months. We’ve talked a lot about munis on the iShares blog including an ongoing call that they are attractive compared with Treasury securities, particularly for taxable investors looking for income.
Last week, Matt Tucker helped explain how investors can determine if a muni or a corporate bond offers a higher yield after taxes.
But we continue to field inquiries from investors who want to go beyond comparing muni yields with Treasury yields or benchmark corporate yields. They contend that comparison misses the possibility that muni yields appear comparatively high because they may reflect a justifiable difference in their credit quality and default potential. In addition, the on-again off-again talk that the muni tax exemption itself may be at risk as part of fiscal negotiations in Washington adds to the concern that a munis comparison with Treasuries may not be an apples-to-apples comparison. [Muni Bond ETFs: Migratory Patterns]
To tackle the credit quality concern I want to run through a comparison of muni yields against corporate debt yields. In particular, I’ve taken the yields of the standard 20 Bond Buyer General Obligation Index (which consists of 20-year AA-rated munis) and the yields of the Moody’s AA-rated corporate index (which are long-term and similar maturity to the Bond Buyer index) [1]. This comparison is likely conservative because historical evidence suggests that munis generally have lower default rates than corporates of similar ratings [2]. Indeed, we’ve seen that even after the financial crisis munis have shown much lower default rates than many financial commentators predicted.
To make the comparison I have focused not on the yield difference between the two types of securities, but I have instead computed the tax rate at which the two yields would be equivalent for a taxable investor. For example, if an investor faces a tax rate of 25% then a 3% yield in a tax-exempt muni security is equivalent to investing in a corporate that yields 4% — because that yield will be taxed at 25%, resulting in an after-tax yield of 3%. In this example the “breakeven tax rate” for the 3% tax-exempt muni compared to the 4%-yield corporate is a 25% tax rate.
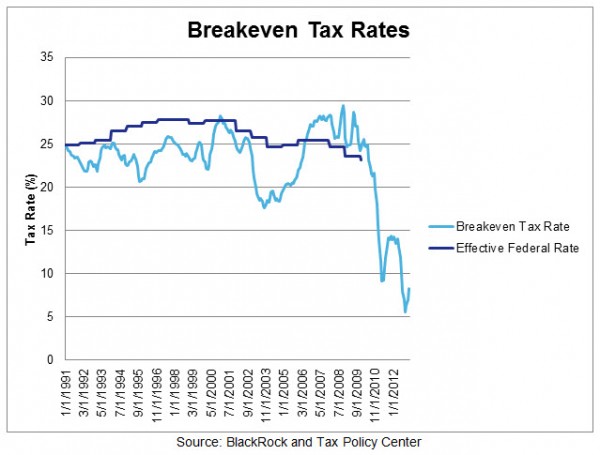
The chart below shows this breakeven tax rate since the early 1990s. The chart also shows the actual effective tax rate for households in the top quartile of income as reported by the Tax Policy Center until 2009 (the most recent year available).
Two things are immediately obvious from the chart. First, the breakeven tax rate has, at least on average, been reasonably close to the actual effective tax rate experienced by upper-income households (those most likely to buy and hold muni securities). Second, and most important, the current breakeven tax rate, while higher than during the depths of the crisis, is well below its historical mean and below the actual level of effective tax rates over the last 15 years.