It’s the time of year when investors are busy with year-end portfolio positioning. Many investors are looking for opportunities within their individual portfolio to benefit from tax loss harvesting – selling securities at a loss to offset capital gains in other parts of their portfolio.
At the same time, they’re keeping an eye on the broader market and possible portfolio positioning to take advantage of the so-called January effect, when stock prices may experience a “bounce” partly because some of December’s selling was tax motivated and thus temporary.
But for investors trying to gauge the size of the upcoming January effect and position a portfolio for a possible bounce, I thought it would help to put some context around the supposed size of this effect while also highlighting that this year, fiscal cliff wrangling could throw a wrench into any typical January effect.
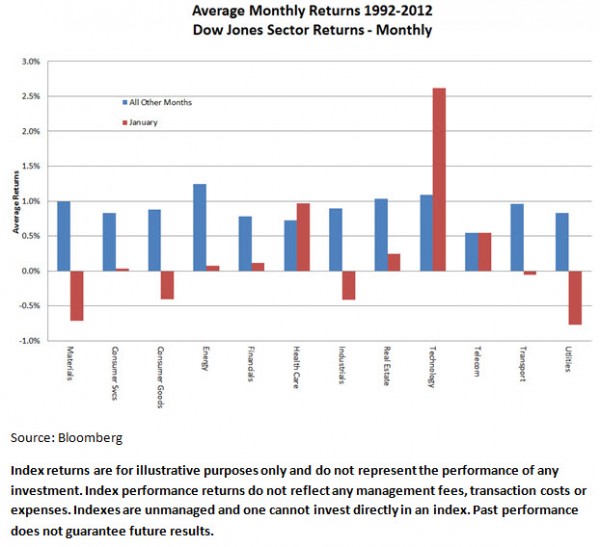
First, while there is evidence of a January effect across a wide range of studies, including from the psychology literature[1], the size of the effect at the broad asset allocation level in particular is highly uncertain. That makes it hard to use as a guide for portfolio positioning in any given year. To illustrate, the chart below shows the average return over the last 20 years for the month of January, as compared to all other months, across a suite of U.S. equity sectors.
The result may be unexpected for those readers unaware of just how noisy the January effect is, even when measured over periods as long as 20 years. In this case, we see that only for the technology sector is the mean January return higher than the average of other months. But in that case, the effect is not statistically significant because it is mostly the result of a large return in the last two years due to the tech bubble.
In addition, there is also no evidence that those sectors that had low or negative returns in the months leading up to December — where the incentive to engage in tax-loss selling prior to the end of the year is the largest — had any better January returns than the average. Indeed, the average returns in January for a sector that had negative returns up until November of the previous year are actually worse (at -5bps) than the overall January return average (at +19bps)[2]. We see that there is no clear “bounce effect”.
Finally, and perhaps most importantly, this year there is the added noise of fiscal cliff negotiations and uncertainty around what the tax landscape will look like in 2013. Currently, without any action from Congress, the rate on both long-term and short-term capital gains could increase next year. This is likely to confound December’s traditional tax-loss-selling story. As Russ has highlighted, investors who anticipate a capital gains tax increase may have an incentive to sell securities that have gains — even if that generates a larger tax bill this year — in order to avoid a potentially larger bill next year. In other words, the “traditional” December focus of tax trading on poor-performing securities may be obscured by additional tax-related trading on securities that have performed well. The data record does not contain obvious comparable cases in the last 20 years to analyze that aspect of story but it is likely to have an impact on the January effect.
In the end, each individual investor should consider their particular tax situation carefully. But insofar as broad portfolio positioning is concerned, sticking to the fundamentals is likely better than the hard squinting that is needed to read the statistical tea-leaves on the potential for a January effect. We continue to advocate a generally defensive position, including with dividends and a well-diversified allocation to international equities.
Daniel Morillo, PhD, is the iShares Head of Investment Research.
[1] See, for example, “Yes, Wall Street, there is January effect! Evidence from laboratory auctions”. Anderson, Gerlach and diTraglia.
[2] Data is sourced from Bloomberg, obtained for each of the sectors as total return index. Monthly returns are computed from the index data and averaged across the last 20-years of data.