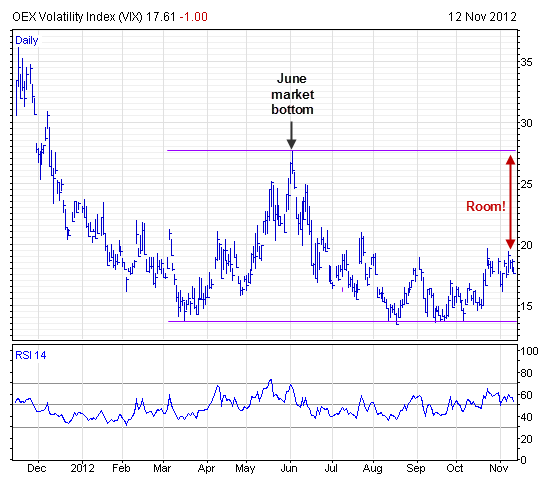
The spot VIX chart “shows trading moving up gradually from the bottom of its 2012 range,” said Coe at Investors Intelligence. “That move is barely half way and momentum is not overbought. A spike, should it occur, would encounter resistance between 25 and 28.”
CBOE Volatility Index
iPath S&P 500 VIX Short Term Futures ETN

Full disclosure: Tom Lydon’s clients own VXX.