When investing in any exchange traded fund, one should have a clear strategy in place. Instead of relying on gut feelings or fight-or-flight instincts, investors can look at the trend lines to get a sense of when they should be in or out.
For instance, Greg Harmon for Dragonfly Capital tracks the percentage of stocks trading above their 200-day simple moving average, or SMA.
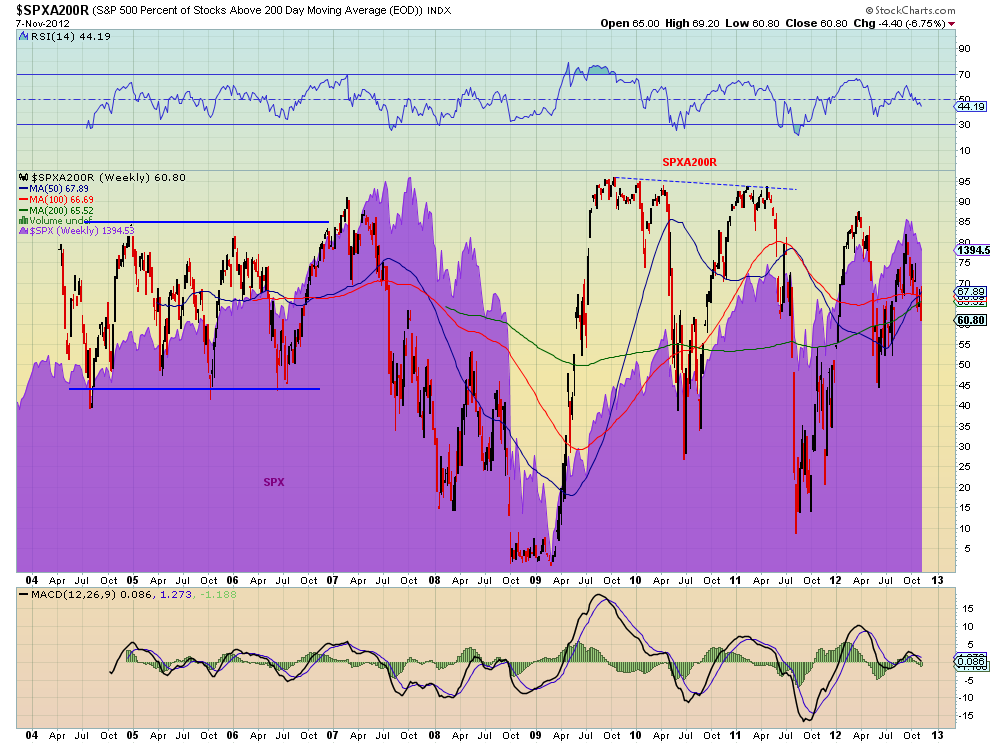
Harmon points to a nine year chart, with the purple background indicating the actual movement in the S&P 500.
Investors will notice that market bottoms typically occurred when the percentage of stocks over the 200-day SMA dipped below at least 45%. With a level of 60.8 today, Harmon cautioned that “there is still room for a lot more downside.”
Here at ETF Trends, we look at an ETF’s 200-day exponential moving average to determine buy or sell positions. If the fund is above its 200-day EMA, it is positive signal, whereas if the fund decreases below the trend, it is an indicator to get out. [An ETF Trend-Following Plan for All Seasons]
Currently, most broad stock ETFs are hovering around or below their 200-day EMAs:
- SPDR S&P 500 ETF (NYSEArca: SPY): 0.7% above its 200-day exponential moving average
- Powershares QQQ Trust ETF (NYSEArca: QQQ): 1.7% below its 200-day exponential moving average
- SPDR Dow Jones Industrial Average ETF (NYSEArca: DIA): 0.4% below its 200-day exponential moving average
- iShares Russell 2000 ETF (NYSEArca: IWM): 0.8% below its 200-day exponential moving average
For more information on tracking investment trends, visit our trend following category.
Max Chen contributed to this article.