Key U.S. stock benchmarks and stock exchange traded funds are dipping below their long-term trend lines, triggering sales by investors and advisors who use moving averages.
The S&P 500 was hovering near its 200-day moving average, but with Tuesday’s drop, the benchmark was over 7 points below, reports Mark Hulbert for MarketWatch. [Investing with ETFs and 200-Day Moving Averages]
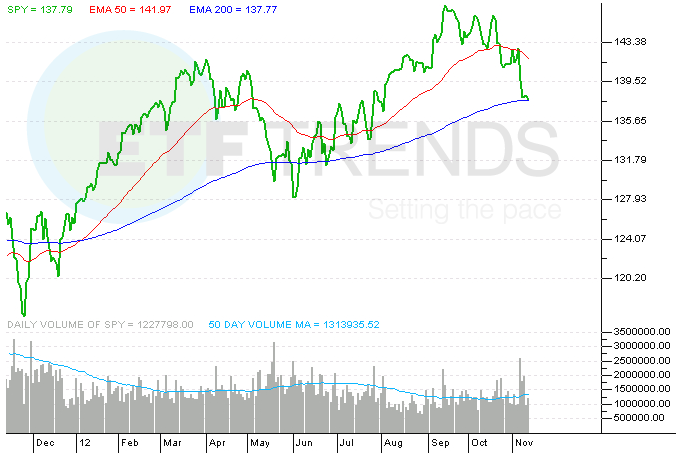
The SPDR S&P 500 ETF (NYSEArca: SPY) is 0.5% below its 200-day exponential moving average.
Historical data revealed that the 200-day moving average has been a good indicator of market entry and exit points that would help generate higher returns than sitting idly through the market turns.
In a hypothetical portfolio of the Dow using the 200-day moving average back-tested to the late 1800s, Hulbert discovered that a 200-day moving average portfolio generated 6.7% annualized returns over a 116-year period, compared to a 5.1% return from a buy-and-hold position, excluding dividends, interest on cash and commissions.
Additionally, the trend following portfolio’s risk-adjusted performance was better since it would hold cash and stay out of market volatility when below its 200-day moving averages.
If you are following the long-term trends, the current dips below the the long-term trends should signal investors to start leaning toward a cash heavy position. [An ETF Trend-Following Plan for All Seasons]
SPDR S&P 500 ETF
For more information on tracking investment trends, visit our trend following category.
Max Chen contributed to this article.
Full disclosure: Tom Lydon’s clients own SPY.