IJH debuted in June of 2000 while MDY launched way back in May of 1995 as truly one of the “pioneers” of the ETF industry. Head to head since inception however, even though these two funds track the same underlying index, IJH has outgained MDY (+120.12% versus +116.98%) which over time, is some impressive and demonstrable “recapture” of basis points over time to the underlying benchmark.
This live performance history, coupled with the fact that IJH sports a 20 bps expense ratio to investors versus MDY’s 25 basis point expense ratio, has provided the impetus for RIA and institutional investors alike to transition their mid cap equity allocations away from MDY to some degree and into IJH. The evidence is noted in that IJH is now the largest mid cap equity ETF in the space, with $11.8 billion in AUM compared to MDY’s $9.6 billion in AUM.
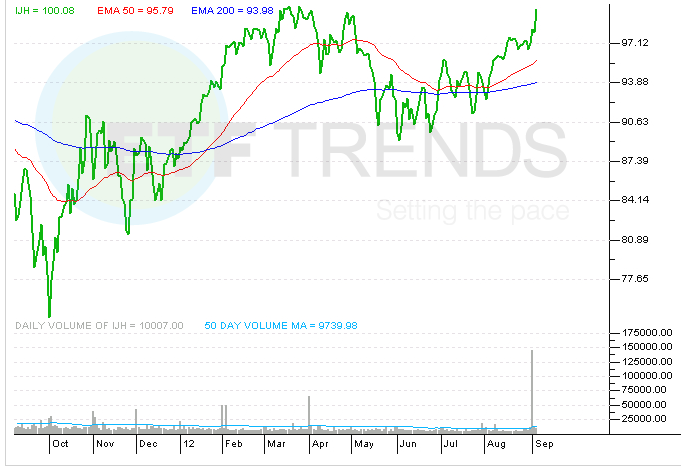
iShares MidCap400
For more information on Street One ETF research and ETF trade execution/liquidity services, contact Paul Weisbruch at [email protected].