While it might not seem like it, we’re in the midst of a stock market rally.
On Tuesday, the S&P 500 Index touched its highest point in more than four years and major European markets edged higher on hints of progress in solving the region’s sovereign debt crisis. Admittedly, it might not be the strongest of rallies with many traders complaining of weak volume and narrow gains, but it does mark the year’s second rally.
So, where are investors choosing to take on risk today? And how does it differ from the beginning of the year, when global stock markets rallied in January and February?
To answer those questions we decided to compare ETF fund flows during the two time periods. We studied flows from January 2 until February 29, and compared those to flows from June 1 until August 17. Granted, we know this isn’t a true apples-to-apples comparison because the time periods are not identical, but we were still curious to see what we could glean from the numbers.
First, let’s look at areas where we found similarities:
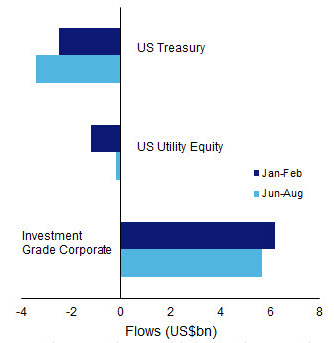
In both rallies, utility stock ETFs — considered a defensive play — saw outflows. Investors also moved from traditional safe-haven investments like US Treasuries into investment grade corporate bonds.