European financial and economic turmoil has plagued markets for more than two years, yet officials have so far failed to find a comprehensive plan to solve the root causes of the crisis. Europe remains mired in deep recession, Greece is effectively in a depression and – despite measures announced at the June G20 meeting – the risk of Spain and Italy becoming overwhelmed by the crisis remains high.
In this environment most “safe haven” assets have performed well, with G-3 bond yields falling to all time lows earlier this year. The one stand-out exception has been gold, which has performed poorly so far this year. Gold’s poor performance in an environment of high sovereign risk has understandably caused some investors to question its historic “store of value” credentials.
In this article we look at some of the key factors that have driven the gold price in recent years, explain what has been behind the relative underperformance of the gold price so far this year, and assess the outlook and likely key catalysts for gold price performance for the rest of the year.
Since the beginning of the credit crunch in August 2007, gold has risen 140%, reaching a peak of around $1,910 an ounce on September 5, 2011. Over the period, as the financial crisis has unfolded, engulfing major financial institutions and countries, investors have sought refuge in the perceived safety of gold and its properties as an inflation, currency debasement and tail-risk hedge. However, gold has not always behaved like a safe-haven and its performance has been driven by a variety of factors, as key events have had diverse effects on investors’ behavior.
Key Events Affecting the Gold Price Over the Past 5 Years
The Beginning of the Financial Crisis
The collapse of Lehman Brothers in September 2008 sent a wave of fear around world financial markets. Most financial assets were heavily affected in the months following the announcement. Gold, after having risen 19% in the year running up to Lehman Brothers’ bankruptcy, fell by 4% in the two months leading up to the US Fed’s announcement of the first round of quantitative easing (QE1), likely as a result of general investor deleveraging.
Quantitative Easing 1 (QE1)
On November 25, 2008 the US Federal Reserve announced its first round of quantitative easing (QE1), consisting of the purchase of US$100bn of direct obligations of housing-related government-sponsored enterprises (GSEs) and US$500bn of mortgage-backed securities (MBS). On March 18, 2009, the Fed announced it was expanding its MBS program to US$1.25tn and buying up to US$300bn of longer-term Treasury securities. The bullion price surged by 36% in the four months following QE1, rising to US$1,110/oz.
The European Crisis
The European sovereign crisis kicked-off in 2010 with the first bailout to Greece on May 4, 2010. This was followed by the bailout of Ireland in November 2010, Portugal in May 2011 and eventually a restructuring of Greece’s debt in July 2011. The reaction of the gold price to these events has varied, but the general trend has been up. Although the gold price has increased by 40% over the period, most of the gains appear to have been tied to the Fed’s quantitative easing policies. As detailed later in this note, the reason behind the unusual behavior of gold can be narrowed down to its the sensitivity to both changes in the perceived outlook for the real purchasing value of the US dollar and its responsiveness to sovereign risk.
Quantitative Easing 2 (QE2)
Weakening labor market data and lower than expected growth in the US led the way to the second round of quantitative easing (QE2), announced by the Fed on November 3, 2010. The central bank committed to purchase a further US$600bn of longer-term Treasury securities by the end of the program. In this period, the gold price rose by 11% to US$1,500oz. However, the largest spike in the gold price took place in September 2011, when a combination of expectations of a further round of QE, the downgrade of US debt and the worsening of the European crisis drove the gold price to an all-time high above US$1,910/oz.
Operation Twist
“Operation Twist” is a policy put in place by the Fed to push down long-term interest rates by buying longer-term government bonds, funded by simultaneous selling of shorter-term treasuries. The initial US$400bn operation carried out in 2011 was followed in June 2012 with an extension of the program by a further US$267bn. The recent extension of operation twist was greeted with some disappointment by gold investors who hoped a QE3 program might be announced.
Gold, Real Interest Rates and Volatility
Historically, gold has tended to perform best during periods of low real interest rates and high monetary expansion, as they are often associated with currency debasement and systemic financial failures.
The demand for gold has tended to move inversely to real interest rates due to the reduced opportunity cost of holding gold versus interest-bearing investments and its inflation hedge properties. With governments around the world having to contend with weak economic growth, and structurally burdened by the need for multiple years of government, bank and consumer deleveraging, real interest rates have been pushed to exceptionally low levels. Most central banks have adopted an expansionary monetary policy to support growth and financial systems. This has provided a foundation of support to the gold price.The Federal has more than tripled the US base money supply through two rounds of quantitative easing, raising concerns about the future real purchasing power of the US dollar, increasing demand for gold as a hedge.
Gold has traditionally been considered a hedge against financial risk, due to its low correlation with major equity markets and risky assets on the back of its “hard asset” status. However, with the end of the second round of quantitative easing on June 30 2011, the positive correlation between the gold price and risk, as measured by the VIX index, began to fall, turning negative in October 2011. The reversal of the correlation between gold and financial risk is also evident when looking at the relationship between the gold price and Spanish credit default swap (CDS) spreads. Since the end of last year Spain’s bond spreads have surged as growing concerns about Spain’s banking system and fiscal profile caused investors to reduce exposure to Spanish sovereign bonds. Despite the rise in sovereign risk, gold price performance has been lackluster. Why has gold not been benefiting more from this sentiment? As we describe in more detail in the next section, the strength of the US dollar has likely been a key factor dampening the gold price’s reaction to rising risk. And quantitative easing remains a crucial driver of both US dollar and gold price performance.
In recent weeks, it has become increasingly clear that another round of quantitative easing from the US Fed is the main catalyst investors are waiting for – both for US dollar weakness and gold price performance. The gold price jumped by 6% at the end of May as weaker than expected US non-farm payroll numbers (69K vs 150K expected) lifted investors’ hopes of further quantitative easing. Yet, the gold price rise was short-lived as Bernanke, speaking at the FOMC meeting on June 20, affirmed his intentions to extend Operation Twist by US$267bn, disappointing investors who were hoping for a QE3 program to be announced. However, the Fed has made clear that with inflation now under control, its focus is increasingly skewed towards the second objective of its double mandate – job creation. The US needs employment growth of 100,000 just to maintain “stability” in the job market. The indication from the June FOMC meeting announcement is that consistent numbers below 150,000 are likely to trigger another round of QE. If non-farm payrolls and other growth indicators such as the monthly ISM surveys do not quickly show substantial and sustainable improvement, a new round of QE seems increasingly likely. With some form of QE3 getting closer and Europe financial and sovereign risks still high, there are good reasons to believe the gold price will move higher in the coming months.
Gold and the US Dollar
The gold price has traditionally tended to be negatively correlated to the US dollar, highlighting gold’s value as a hedge against structural US dollar weakness. The elevated level of risk and uncertainty that has led to investors’ deleveraging has forced the US dollar higher and played a key role in hampering the performance of gold since September 2011, making it less positively correlated to systemic risk in Europe. Growing investor concerns about the potential negative implications of a disorderly exit of Greece from the Euro, and of Spain and Italy’s growing sovereign and banking problems, spurred investors’ demand for “safe-haven” G3 bonds (US Treasuries, JGBs and Bunds) sending yields to all-time lows in June 2012.
While one would intuitively expect that this would also benefit the gold price, in fact the gold price was on a general declining trend during this period. A key reason for this is that with the stress focused on Europe, the increased risk perception also pushed up the US dollar versus the euro, triggering selling of gold by short-term investors. In other words the European crisis has been enough to spark euro weakness, but has not yet become severe enough to trigger fears of an imminent euro breakup and flight capital flows into gold.
Parallels with 2008
In addition, the recent weakness of the gold price has some similarities to the situation in 2008, when the gold price dropped 27% between July and October as investors took profits on their gold positions to cover liquidity needs stemming from redemptions and de-risking. However, over the next four months gold saw a strong rebound in demand that caused the gold price to recover its initial losses and to almost double in value over the next few years, beating most equity benchmarks. In 2011, the gold price saw an initial 19% decline from its all-time high as investors deleveraged when Greece’s second bailout failed to contain the European crisis. However, the gold price quickly recouped its deleveraging-driven losses, rising by 15% in the first three months of 2012, as investor sentiment improved. More recently, through most of Q2 2012, investors have again de-leveraged and built their cash positions as the conditions in Europe have deteriorated, pushing up the US dollar and dragging down the gold price.
Conclusions
The recent behavior of the gold price has caused some investors to question gold’s safe-haven properties. A deepening crisis in Europe and uncertainty about the likelihood and timing of another round of quantitative easing by the US Fed have pushed investors to the sidelines, with cash and G-3 bonds the primary beneficiaries. Investor deleveraging and flight from the Euro has forced the US dollar higher, dampening gold’s sensitivity to systemic risk and hampering its performance since September 2011. However, with “operation twist” coming to an end in the next few months, US employment data indicating a stagnating US labour market and Europe’s politicians still far from a comprehensive solution to the region’s problems, the likelihood of another round of US quantitative easing is increasing. While the rising expectation of another round of QE3 is the most likely catalyst for the next leg of the gold bull market, the lower probability, but high impact risk of a full-blown Euro crisis would also likely cause the gold price to break higher.
ETFS Physical Swiss Gold Shares (NYSEArca: SGOL)
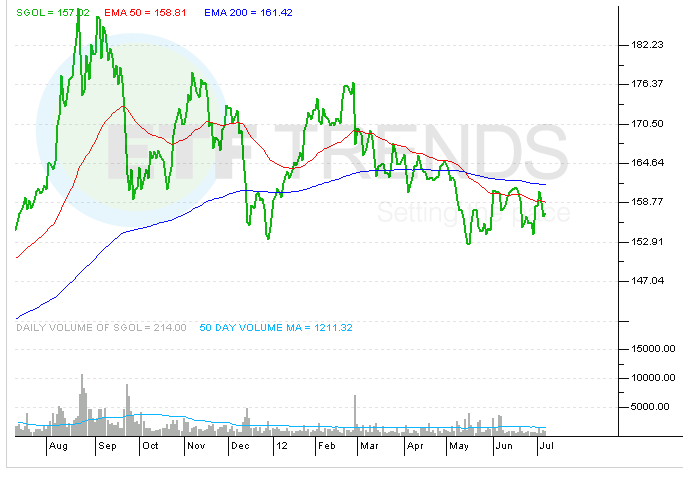