Trading in futures contracts based on the CBOE Volatility Index, or VIX, is near record levels along with exchange traded products linked to Wall Street’s “fear gauge.”
From a fund flows standpoint, Volatility based products were once again in play, as iPath S&P 500 VIX Short Term Futures ETN (NYSEArca: VXX) took in an impresive $600 million plus in new assets last week, which is approximately 30% of the total assets outstanding in the fund. [Trading in Volatility ETF Ramps Up]
This comes just a week or so after issuer VelocityShares halted creations of its popular VelocityShares Daily 2X VIX Short Term ETN (NYSEArca: TVIX). [Volatility ETF Trading Volume Jumps After TVIX Suspends Issuance]
All in all, we have noted a huge pick up in trading activity across the spectrum of “Vol” products, including the aforementioned funds as well as lesser known products such as ProShares Ultra VIX Short Term Futures ETF (NYSEArca: UVXY). The funds track VIX futures.
With the VIX itself well off of recent highs near the $22 level and closing on Friday at $17.29, it seems feasible that institutional players are establishing protection against the possibility of a volatility spike, but it is hard to say that it is an outright bearish view against the market itself.
In fact, an interesting article surfaced in this weekend’s Wall Street Journal titled “A Contrarian View on Fear” where the belief that the surge in recent activity in VIX futures and related Volatility ETFs and ETNs has been driven by bigger risk appetites for individual equities and as some portfolio managers continue to get comfortable “longer” equities into the 2012 rally, they are also establishing volatility hedges along the way.
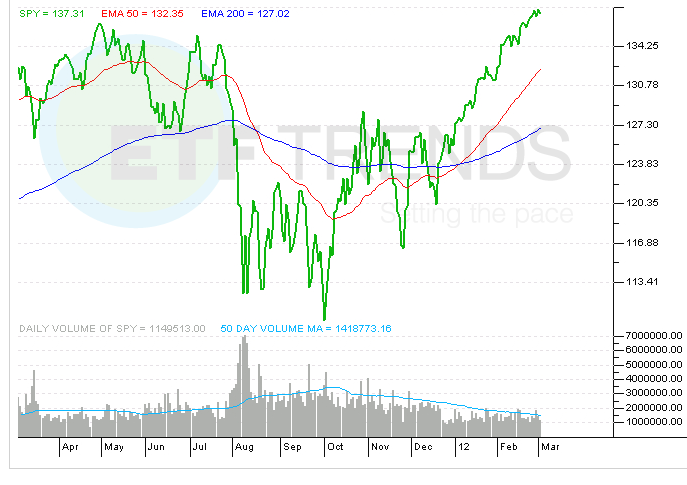
On that note, SPDR S&P 500 (NYSEArca: SPY) was the leader in net creation activity last week, reeling in nearly $3 billion in new assets. Interestingly, SPDR Gold Shares (NYSEArca: GLD), despite an absolute drubbing on Wednesday of last week, saw net creations as well, in the neighborhood of about $600 million which shows the presence of “bargain hunters” potentially adding to positions or establishing new entry points as the 50 and 200 day moving averages in GLD itself are nearly in line with each other at the moment.
SPDR S&P Retail (NYSEArca: XRT), which we noted was extremely active last week with more than $300 million in new assets appearing in the fund via creations, lost a good $200 million last week in net redemptions, and the ETF which is often used as a hedging tool by short sellers and portfolio managers against individual retail equities that may be in their portfolios, seems to be short term play once again. [ETF Chart of the Day: Retail Sector]
Several other equity sector funds saw notable outflows as well, including Materials Select Sector SPDR (NYSEArca: XLB) which lost about $200 million in assets (about 10% of outstanding AUM) and XME where about 7% of the outstanding assets under management flowed out. [ETF Chart of the Day: Basic Materials]
Volumes across the equity universe last week were roughly around average on the whole, but commodities, prompted by the large sell off in Gold mid week and other precious metals were exceptionally active in multiple sessions, with ETFs such as PowerShares DB Commodities (NYSEArca: DBC) trading well above average volumes.
Finally, on the currencies front, the Euro seemingly hit a wall last Wednesday, seeming to coincide with the steep Gold sell off, and fell precipitously versus the U.S. Dollar in three straight sessions, giving back most if not all of recent gains. This sudden and sharp move seemed to give the indication to the marketplace that the “all clear” signal has still not been given nor has it been received out of Europe, creating an undeniable tension among market participants.
Equity indices closed out the week off of recent highs, as the S&P 500 failed to pierce and close about the 1375 mark on several occasions throughout the week. Our market technician David Chojnacki pointed out in our Friday morning note to trading customers that the 1375 level has presented technical resistance on several occasions recently, but on the flipside, 1363 has displayed formidable technical support and thus any “dips” that are bought around this level have been profitable trades in very short order. He also noted that near term technicals across the DJIA, Nasdaq 100, and SPX remain mostly strong with RSI’s near 70 or above, however all three major indices have negative MACD which “keeps us on guard.”
SPDR S&P 500
For more information on Street One ETF research and ETF trade execution/liquidity services, contact pweisbruch@streetonefinancial.com.