Furthermore, in the trailing one year period, XLE is down 7.49% vs. DBO down 2.69%, and in the trailing 5 year period, performance for both funds is roughly even (DBO +21.14%, XLE +20.89%).
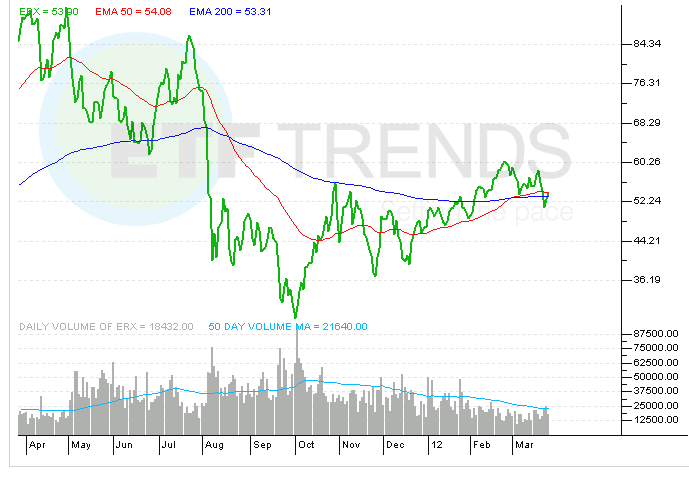
From a technical standpoint it looks like ERX is running into congestion, as it recently found support on its 200 day moving average ($52.53) but there is overhead resistance nearby in its 50 day moving average of $54.42.
Direxion also offers a similar product for “Energy Bear” traders/hedgers whom may be looking to take a bearish trading stance in the Energy equities space, and the fund is Direxion Daily Energy Bear 3X (NYSEArca: ERY).
Direxion Daily Energy Bull 3X
For more information on Street One ETF research and ETF trade execution/liquidity services, contact [email protected].