Exchange traded funds indexed to the S&P 500 are experiencing a bullish technical sign known as a “golden cross” as the 50-day simple moving average crosses above the 200-day. However, the indicator doesn’t have a perfect batting average for predicting rallies.
U.S. stock ETFs have been enjoying a decent rally since the most recent market low in early October of 2011.
According to Birinyi Associates, the S&P 500 is closing in on a golden cross for the first time since 2010, reports Lu Wang for Bloomberg.
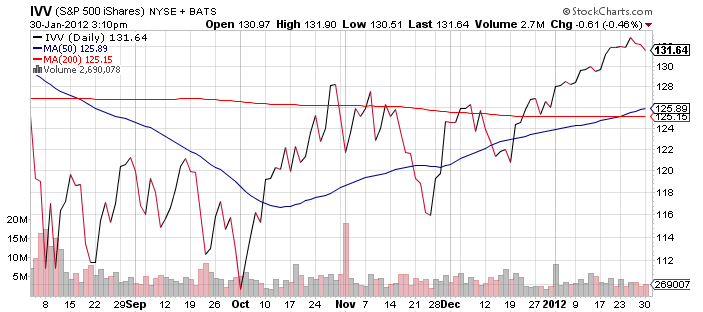
Since the Oct. 3 low, the S&P 500 has gained 20%, bringing the 50-day moving average just a few basis points shy from crossing over the 200-day trend.
Birinyi pointed out that the S&P 500 has formed 26 golden crosses since 1962 when the S&P’s short-term average moved above its long-term trend. The index showed positive returns 81% of the time, with an average increase of 6.6% over the following six months.
“While we choose to disagree with many of the technical analysts’ forecasts and predictions, we would be amiss to not analyze the historical performance and patterns following this market event,” Kevin Pleines, an analyst with the Birinyi, said in a note. “We have found that this technical indicator has some merit.”
iShares S&P 500 (NYSEArca: IVV)
For more information on the broad market, visit our S&P 500 category.
Max Chen contributed to this article.