On Wednesday, more than 4 million shares were purchased, compared to an average daily trading volume of 8,400 shares, and conceptually, even an ETF novice should be able to see why the purchase (approximately $115 million notional) of this many shares is feasible in an ETF that has an index makeup as described above.
Just a handful of the top weightings in EUSA collectively trade a few hundred million shares daily from an equity standpoint in their own rights, and these names have combined market caps that would weigh in the billions of dollars. This said, if a portfolio manager dismisses the false notion of “volume equals liquidity”, the $115 million share trade that occurred in buying this open ended fund, really looks like a drop in a bucket compared to the liquidity present in EUSA.
While we cannot be sure, this large inflow trade could be the result of tax swap related activity heading into year’s end, either at the expense of a similar all cap Equity ETF, or perhaps a large institution is migrating away from an all cap mutual fund manager bench-marked to a similar index as the MSCI USA Index, or even out of an index mutual fund and into this diversified all cap ETF because of the tax benefits and low costs that ETFs deliver to retail and institutional investors alike.
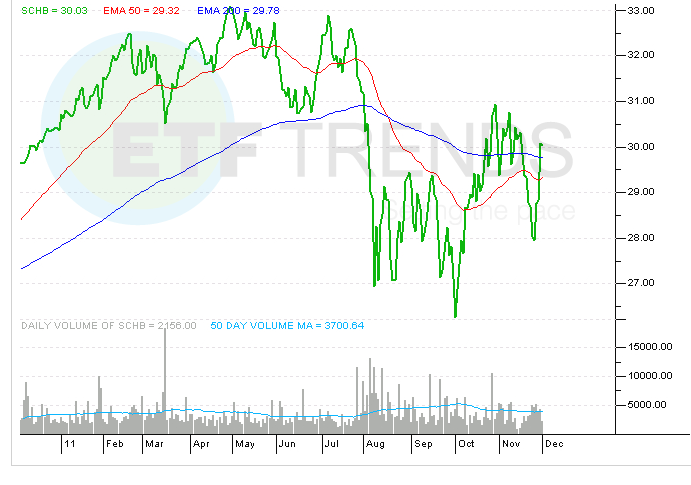
Schwab U.S. Broad Market Index
For more information on Street One ETF research and ETF trade execution/liquidity services, contact [email protected].