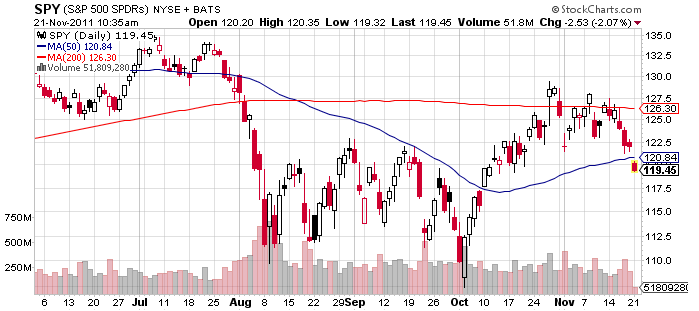
In recent weeks, exchange traded funds indexed to the S&P 500 have been unable to pierce their 200-day simple moving average and sustain any upward momentum.
Equity ETFs stumbled into the week Monday on news Congress’s “supercommittee” is set to announce it has failed to reach a deal on cutting the U.S. deficit. Monday’s sell-off pushed the S&P 500 below its 50-day moving average. [Stock ETFs Down on Supercommittee Failure]
Recent highs of 1,292.66 and 1,277.55 were registered in the past month in the S&P 500, but were quickly met with selling pressure as an extended rally in equities has been anything but sustainable.
Last week was marred with more negative energy coming from the European markets that did not translate well here in the U.S., and the S&P 500 closed at its lowest point in about a month.
Our market technician David Chojnacki recently pointed out that the range in the SPX has been narrowing, and was developing a “pennant pattern.” In technical analysis, this is a continuation pattern that exhibits smaller ranges and lower volatility, and in our estimates, a 5% move to the upside is very possible based on the current technical set up.
Even a novice to technical analysis can look at a chart of the SPX and will note that since the markets fiercely rebounded from the early October lows, that the trend has been somewhat of a narrow channel in between SPX 1,200-1,300, with volatility lessening as time has gone on.
On the note of volatility, the VIX crept higher on the week but still remains below its 50-day moving average. From an options standpoint, mostly upside call buyers, mainly in 40 and 47.50 strikes have been present in VIX, and are likely hedging portfolios going into year end against any unexpected events that may cause a sudden and severe spike in overall volatility.
From a fund flows standpoint, volumes were low last week, which is not entirely surprising heading into the shortened week of Thanksgiving, and even options expiration on Friday failed to give the market much momentum in either direction. With the SPX continuing to channel in between its 200- and 50-day moving averages, we will watch closely in coming weeks to see if there is any indication of a breakout or breakdown of any type.
One market leader, the Nasdaq-100 did catch our attention this week however. The Nasdaq index has previously spent 26 consecutive trading days above its 200-day moving average, but in a two day period beginning on Thursday of this week, it crashed through both its 200 and 50 day moving averages, largely on weakness in Apple (NasdaqGS: AAPL) and Microsoft (NasdaqGS: MSFT) which make up approximately 24% of the entire index. Also, going into Friday’s session, we noted call buying in a number of inverse/leveraged ETFs including ProShares UltraShort QQQ (NYSEArca: QID), which reflects a short term bearish sentiment in regards to the equity markets.
We are hard pressed to point to any sizable creation/redemption activity last week that shows the footprints of any large institutional asset shifts, as SPDR S&P 500 (NYSEArca: SPY) took in about $1.3 billion in assets on the week, which compared to historical standards is quite normal and unexciting.
SPDR Gold Shares (NYSEArca: GLD) did attract over $1 billion in assets on reasonably heavy volume, as the ETF closed slightly above its 50-day moving average on Friday after flirting with the level the day before, so it seems apparent that gold ETF investors are using the recent weakness in the metal to add to positions.
On this note, iShares Gold Trust (NYSEArca: IAU) also took in well over $100 million in new assets. In general, we saw outflows in names that fall on the “riskier” end of the equity spectrum, but not huge in notional dollar amounts, in names such as iShares Russell 2000 (NYSEArca: IWM), iShares MSCI EAFE (NYSEArca: EFA), iShares MSCI Germany (NYSEArca: EWG), iShares MSCI Emerging Markets (NYSEArca: EEM), Energy Select Sector SPDR (NYSEArca: XLE) and iShares MSCI South Korea (NYSEArca: EWY), and inflows in more stable names including iShares Barclays 1-3 Year Treasury Bond (NYSEArca: SHY), iShares Dow Jones Select Dividend (NYSEArca: DVY), SPDR S&P 500 (NYSEArca: SPY), SPDR Dow Jones Industrial Average (NYSEArca: DIA) and iShares Barclays 20+ Year Treasury Bond (NYSEArca: TLT).
Overall, there was much less pivotal creation/redemption activity last week than in previous weeks, which makes it difficult to draw conclusions on where institutional managers are positioning themselves going into year’s end. That said, we will be mindful of flows during this shortened holiday week to see if anything stands out as something out of the ordinary.
SPDR S&P 500
For more information on Street One ETF research and ETF trade execution/liquidity services, contact pweisbruch@streetonefinancial.com.