The market sell-off has inflicted serious technical damage in exchange traded funds indexed to the S&P 500. The broad-market funds have broken the support trend line from the March 2009 stock bottom after crashing below their 200-day moving average.
Equities were falling Monday after Standard & Poor’s downgraded the U.S. credit rating. “Major technical support levels were broken in all three major averages last week,” wrote David Chojnacki, Street One Financial market technician, in a note Monday.
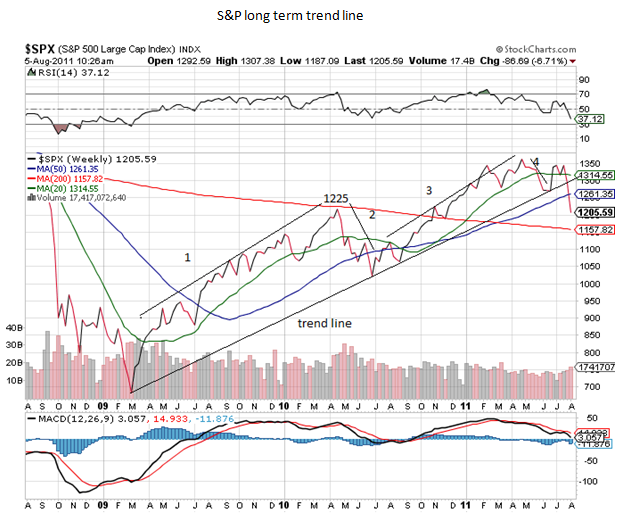
He pegged 1,175 as major support in the S&P 500, a level it was struggling to hold Monday morning, while short-term resistance is near 1,225.
“Long term, the upside bias for the Dow Jones Industrial Average and the S&P 500 remains in jeopardy. We will look for confirmation of breakdown of primary trend. Short term, technicals are extremely weak. We are becoming near term oversold.” [Mapping Out Support Levels in S&P 500 ETFs]
“For investors, the threat of an economic slowdown is quite real. However, balanced against this has to be the fact that falling interest rates, falling stock prices and surging earnings have left stocks looking extremely cheap relative to bonds and cash,” said David Kelly, chief investment strategist at JP Morgan Funds. “The stock and bond markets have already apparently priced in very significant weakness and volatility.”
SPDR S&P 500 ETF (NYSEArca: SPY) and iShares S&P 500 (NYSEArca: IVV) were down more than 2% in Monday’s sell-off.
Chart source: StockCharts.com.
The opinions and forecasts expressed herein are solely those of John Spence, and may not actually come to pass. Information on this site should not be used or construed as an offer to sell, a solicitation of an offer to buy, or a recommendation for any product.