Technical analysts are warning about impending “death crosses” in the major stock averages, even though this bearish signal gave a false alarm last summer when it actually marked the bottom in equity exchange traded funds for 2010.
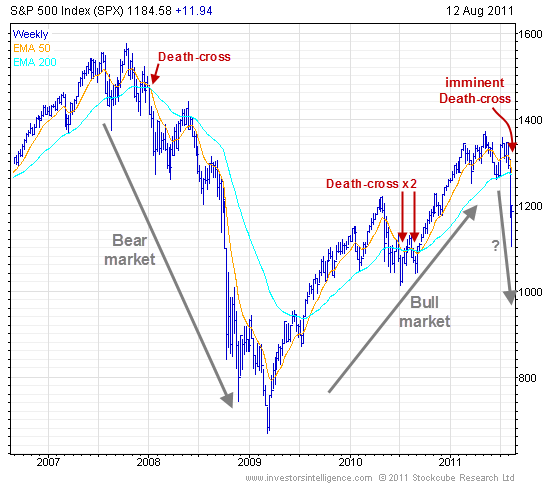
“A death cross is nearing on the S&P 500, a sell signal where the 50-day exponential moving average dives through the 200-day exponential moving average. In the last five years there have only been three occurrences on the S&P 500,” said Tarquin Coe at Investors Intelligence.
“There was one in January 2008 and that proved reliable as the index went onto lose over 50%,” he added. “There were two consecutive death-crosses last summer, one in July and then another in August. Both of those signals failed as did a head-and-shoulders top at the time. It was a bull market so bearish patterns/signals were doomed to fail.”
As last summer demonstrated, the bearish technical indicator has a mixed track record. However, the death cross in financial ETFs earlier this year presaged the sell-off in bank stocks. [Bank of America Caught in Downtrend; Financial ETF Sees ‘Death Cross’]
Also, the recent stock sell-off arrived after the S&P 500 and ETFs tracking the index formed a large “head and shoulders” topping pattern. [Bear Trap or Top in S&P 500 ETFs?]
“Further ‘bear market’ evidence would be on the table should the imminent death-cross prove successful in the weeks ahead,” Coe wrote in a newsletter Friday, adding the signal should print early next week.
The technical analyst also pointed out a bearish cross in an industrial sector ETF.
“Industrial Select Sector SPDR Fund (NYSEArca: XLI) has been leading to the downside since the start of this rout. The relative chart against the S&P 500 has fallen off a cliff since early July,” he said. “This sector has just printed its death-cross. The first since June 2008, a sell signal which proved genuine.” [Leadership Shift in Sector ETFs]