In the mid-cap space, Schwab U.S. Mid-Cap ETF (NYSEArca: SCHM) has gained 5.7% since inception, trailing iShares S&P MidCap 400 (NYSEArca: IJH), which is up 5.8% in the same period. SPDR Midcap 400 (NYSEArca: MDY) and Vanguard Midcap ETF (NYSEArca: VO) have both returned 5.6% and 5.2% respectively during this same time frame. SCHM charges 13 basis points, and is the cheapest alternative in the mid-cap space, where expense ratios among peers go up to 25 basis points.
Finally, in small-caps, Schwab U.S. Small-Cap ETF (NYSEArca: SCHA) is the best performer since inception against its peers, up 46.7%. Vanguard Small Cap (NYSEArca: VB) has returned 45.2%, iShares S&P 600 (NYSEArca: IJR) has gained 44.7%, and iShares Russell 2000 (NYSEArca: IWM) has rallied 42.6%. From an expenses standpoint, SCHA charges 13 basis points while the others in this category range all the way up to 28 basis points. Unlike the State Street, iShares, and Vanguard ETFs, Schwab’s are based on Dow Jones Indexes instead of MSCI, S&P, and Russell indexes. From a market capitalization, assets under management standpoint, SCHX has attracted about $619 million in assets, followed by SCHA with $528 million and SCHM with $93 million.
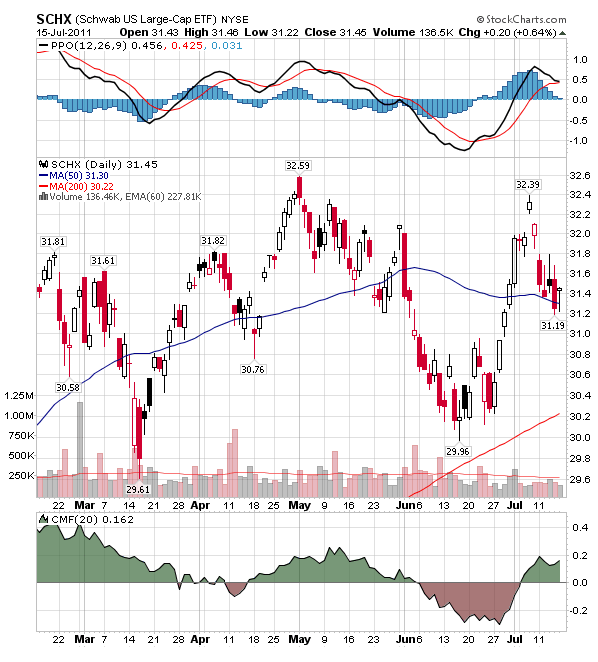
Schwab U.S. Large-Cap ETF
Chart source: StockCharts.com.
For more information on Street One ETF research and ETF trade execution/liquidity services, contact [email protected].