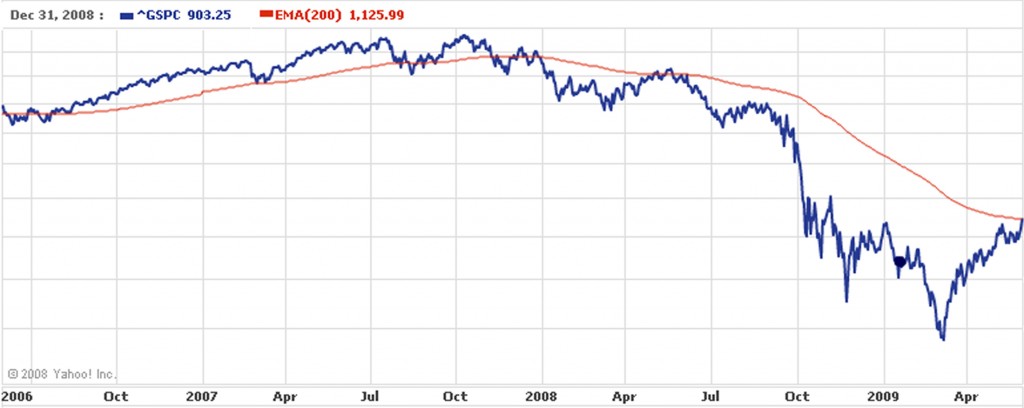
In another sign pointing to a market and economic recovery, for the first time since Dec. 26, 2007, the S&P 500 has broken above its 200-day moving average. What’s the big deal?
What does it mean? Some investors are skeptical that this rally is for real. There’s been talk of a double-dip recession. Some think this might be a market waiting to bite as soon as you put your hand in. And who knows – it could. It could end next week, or it could continue to sit above its trend line for the next year.
But understanding the role of the 200-day moving average when it comes to managing your risk shows why this key crossover matters.

We use the 200-day exponential moving average, which is more sensitive to recent changes in the market,