Sector allocations: consumer discretionary 3.3%, consumer staple 7.7%, energy 21.5%, financials 19.4%, health care 16.6%, industrials 4.7%, information tech 5.3, materials 6.5%, telecom services 13.7%, utilities 1.4%
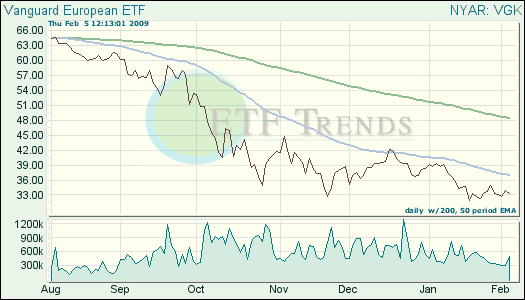
Vanguard European ETF (VGK) has total assets of $16.9 billion, 513 holdings, and expense ratio of .12%. Vanguard European ETF tries to track the performance of a benchmark index that measures the investment return of stocks located in the major markets of Europe.
Top 10 country allocation: U.K. 30.2%, France 15.8%, Germany 13.5%, Switzerland 12.7%, Spain 7.0%, Italy 5.5%, Netherlands 3.8%, Sweden 3.1% Finland 2.1%, Denmark 1.3%.
PowerShares FTSE RAFI Europe Portfolio (PEF) has total assets of $4.5 million, 1000 holdings, and expense ratio of .75%. It is based on the FTSE RAFI Europe Index, which tracks the performance of the largest European equities.
Top 10 country allocations: U.K. 32.3%, France 17.1%, Germany 13.4%, Switzerland 8.7%, Italy, 7.5%, Spain 5.5%, Netherlands 4.7%, Sweden 3.3%, Finland 1.7%, Belgium 1.4%.
Sector allocations: consumer discretionary 9.9%, consumer staples 10.0%, energy 14.2%, financials 25.9%, health are 7.5%, industrials 8.3%, information tech 1.9%, materials 5.9%, telecom services 9.7%, utilities 6.8%.
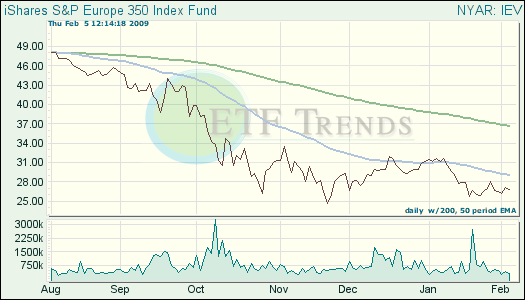
iShares S&P Europe 350 Index (IEV) has total assets of $1.2 billion, 348 holdings, and an expense ratio of 0.60%. The index fund translates investment results that correspond to the performance, before fees and expenses, of stocks across a range of industries in continental Europe as represented by the S&P Europe 350 Index.
Top 10 securities holdings include: U.K. 11.5%, Switzerland 8.1%, France 2.7%, Spain 2.0%
Sector allocations: financials 18.5%, consumer staples 12.9%, energy 12.8%, health care 12.6%, industrials 8.6%, telecom services 8.6%, utilities 8.5%, consumer discretionary 7.4%, materials 6.8%, information tech 3.0%.


