In May 2008, commodities and their related exchange traded funds (ETFs) were booming. Oil and gold seemed unstoppable; food prices were causing people to hoard rice and it wasn’t unusual to see someone softly crying while they filled up their gas tank.
We wrote a report back then, which thoroughly covered the commodities area, from the broad-based funds to the single commodities. From that report, many commodities went on to hit record highs.
How things have changed. Oil, gold, gas and more all have corrected sharply. It’s a matter of great debate now what’s going to happen next. One thing that’s for certain is that the tanking of most commodities illustrates the importance of having an exit strategy. Our own is to exit when a fund is 8% off the recent high or below its 200-day moving average – and most commodities are off their highs by double digits.
Right now, there’s a looming threat of inflation. The government is printing new money by the truckload, which could lead to an inflationary situation down the road. Commodities are often high first, which is why they’re still worth keeping an eye on despite the correction.
Some, like Jim Rogers, say not to count out commodities, now or ever. That’s because the credit crisis is creating an inability for farmers to get loans, which means they can’t grow. This will lead to supply shortages, after which high prices ultimately will follow. Food demand is expected to increase, as populations in emerging markets boom and many of those areas adopt a more western diet. Staple commodities, such as corn, soybeans, wheat and sugar could very well continue to see historic levels of demand. And the assets flowing into such ETFs don’t seem to have slowed much, either.
This fascinating chart from U.S. Global Investors shows how commodities over time might have price swings, but eventually revert to their long-term averages, also known as “mean reversion.” Not one category in this chart has shown any consistency in the nine-year period it tracks. By allocating your assets and remaining diversified, investors can gain some volatility protection.
Oil has been holding steady for a few weeks, around the $40 a barrel mark. There’s a big fight going on now: declining consumer demand that remains far below production, and OPEC can’t seem to cut production enough at this point.
Gas prices are moving up, however. In the last month, the cost of a gallon of gas in Orange County has risen 27 cents. The disconnect between the two can be blamed on refineries, which are operating at their lowest capacity since 1992.
The outlook for gold is mixed. While there’s agreement that prices will probably stay put for now, the question is how high will they go? Some call for $1,500 an ounce, others are expecting as high as $2,000 an ounce.
No one can say for certain where commodities are headed, which is why we so firmly adhere to the trend-following strategy instead of relying on predictions that are often at odds with one another. Many hours have been spent by experts, trying to call which way commodities will go and when. For now, we’re going to wait for the trend to appear. At the moment, it’s simply not there.
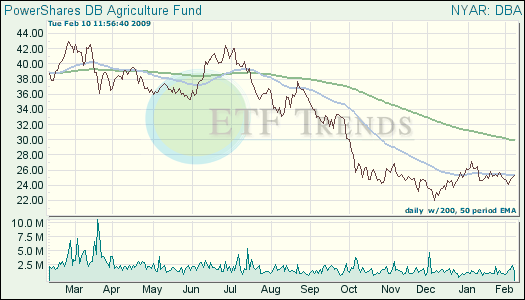
- PowerShares DB Agriculture (DBA) is an ETF that contracts on some of the most liquid and widely traded agricultural commodities — corn, wheat, soybeans and sugar. DBA hit a high on Feb. 26, 2008, and has fallen 41.3% since then.

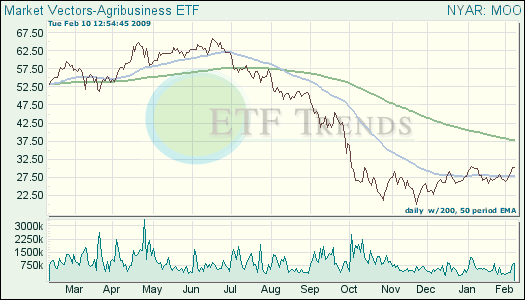
- Market Vectors Global Agribusiness (MOO) tracks the stock-based DAXglobal Agribusiness Index and provides exposure to 40 worldwide companies in five segments: agricultural chemicals, agriproduct operations, agricultural equipment, livestock operations and ethanol/biodiesel production. The top five components, by market weight, include: Mosaic Co. (MOS), Potash Corp. (POT), Monsanto Corp. (MON), Deere & Co. (DE) and Archer-Daniels-Midland (ADM). MOO’s high was on June 17, 2008; it has since declined 54.3%.

MOO made a distribution on Dec. 26 that is not reflected in the chart above.
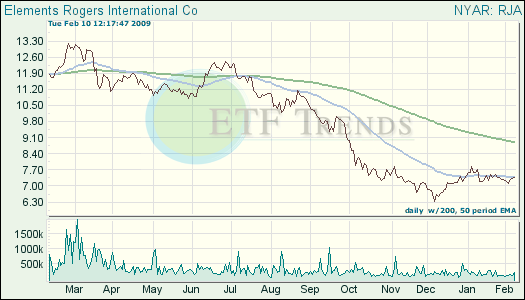
- ELEMENTS Rogers International Commodity Agriculture ETN (RJA) seeks to replicate an index that represents the value of 20 agricultural commodity futures contracts. RJA’s high was hit on Feb. 26, 2008, and the ETN has declined 44.2% since then.
