U.S. equities have been swinging back and forth in a range on the latest Eurozone debt crisis news after October’s rally. Technicals may also be at work as exchange traded funds indexed to the S&P 500 weave around the 200-day moving average, an important indicator, before their next big move.
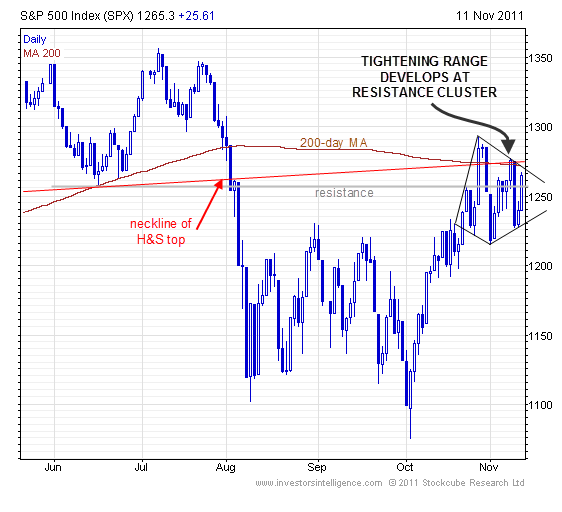
“The S&P 500 is coiling,” said Tarquin Coe, technical analyst at Investors Intelligence. He said the index is approaching formidable overhead resistance.
“As well as the 200-day moving average resistance and the neckline of a multi-month head-and-shoulders top, there is also horizontal resistance drawn across from the June low,” he wrote in a newsletter Friday. “The tightening near-term range, as highlighted on the chart, will likely continue for a few more sessions yet. The eventual breakout will be explosive and likely news driven.”
A major potential catalyst for stocks later this month is the Nov. 23 deadline for Congress’s “supercommittee” to reach a deal on cutting the U.S. deficit.
The iShares S&P 500 (NYSEArca: IVV) rallied 2% on Friday after Italy’s Senate approved austerity measures, easing concerns over Europe’s credit crisis.
The opinions and forecasts expressed herein are solely those of John Spence, and may not actually come to pass. Information on this site should not be used or construed as an offer to sell, a solicitation of an offer to buy, or a recommendation for any product.