ETF Spotlight on PowerShares S&P 500 Low Volatility (NYSEArca: SPLV), part of an ongoing series.
Assets: $235.5 million.
Objective: The PowerShares S&P 500 Low Volatility Portfolio fund tries to reflect the performance of the S&P 500 Low Volatility Index, which consists of the 100 stocks from the S&P 500 that exhibit the lowest volatility over the last 12 months.
Holdings: Top holdings include: Southern Co. (NYSE: SO) 1.52%, Consolidated Edison Inc (NYSE: ED) 1.39%, Duke Energy Corp. (NYSE: DUK) 1.32%, Progress Energy Inc. (NYSE: PGN) 1.31% and Procter & Gamble Co. (NYSE: PG) 1.30%.
What You Should Know:
- Invesco PowerShares is the provider of SPLV. [ETF Chart of the Day: Low Volatility]
- SPLV has an expense ratio of 0.25%.
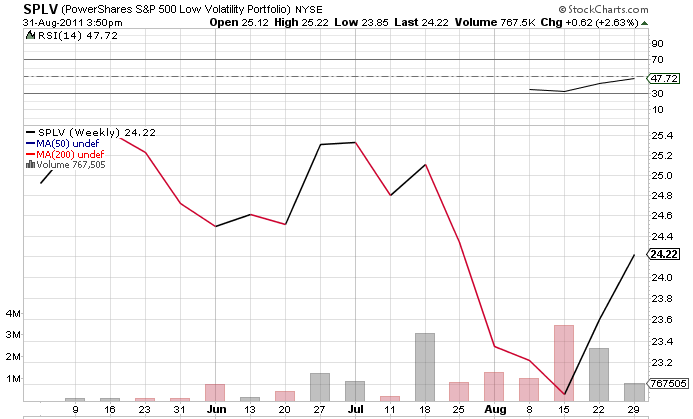
- The ETF has outperformed the S&P 500 recently.
- The fund has gained 2.89% over the last week, but it was down 0.7% over the past month and down 3.46% over the last three months.
- In comparison, the S&P 500 was down 5.91% over the last month and down 8.40% over the past three months.
- Market-cap and style allocations include: Large-Cap Growth 18.33%, Large-Cap Value 47.76%, Mid-Cap Growth 8.62%, Mid-Cap Value 24.35% and Small-Cap Value 0.94%.
- Sector allocations include: consumer discretionary 5.56%, consumer staples 22.67%, energy 2.48%, financials 9.82%, health care 8.79%, industrials 6.44%, info tech 3.58%, materials 4.16%, telecom services 3.74% and utilities 32.75%.
- “This ETF can be considered as an alternative to a dividend or value fund,” commented Michael Rawson, analyst at Morningstar.
The Latest News:
- In line with the low-volatility methodology the fund tracks, large allocations are reserved for stable sectors, such as consumer staples and utilities, along with large- and mid-cap value stocks.
- According to ETF Channel, SPLV has experienced $45.9 million in inflows week-over-week.
For past stories in this series, visit our ETF Spotlight category.
PowerShares S&P 500 Low Volatility
Source: StockCharts.com
Max Chen contributed to this article.
The opinions and forecasts expressed herein are solely those of Tom Lydon, and may not actually come to pass. Information on this site should not be used or construed as an offer to sell, a solicitation of an offer to buy, or a recommendation for any product.