

The key role various inflation measures may play in future Fed rate hikes
By Hafeez Esmail, Main Management
Earlier this month, the Federal Reserve raised its benchmark interest rate (Fed Funds) a quarter point. This effectively takes their overnight lending rate to a target range of 0.75 percent to 1 percent. The median forecast was for three rate hikes in 2017, unchanged from its previous meeting. However, given the positive remarks from a number of Fed speakers, some feel that current projections may be revised to four rate hikes for the current year.
The FOMC’s released a Summary of Economic Projections along with their policy decision statement. The “dot plot” chart contained within the release shows where each member thinks the fed funds rate should be at the end of the current year, following year and year after that, as well as the “Longer run”. The median from the “dot plot” below suggests rates will rise to 1.375% by the end of 2017 and three increases of a quarter percentage point each in 2018.
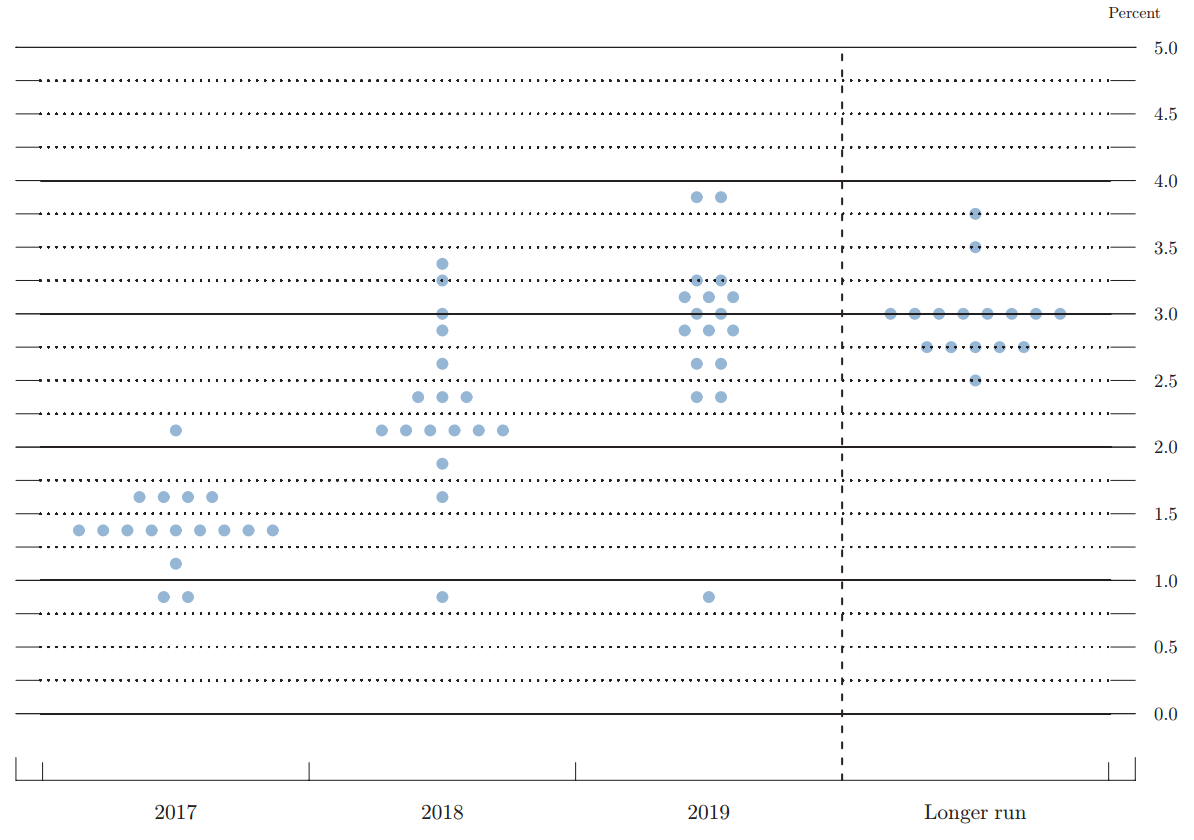
The Market’s initial reaction to the rate hike was positive. The Fed did not change either its long or short term forecasts. They believe real GDP growth will be 1.8%, unemployment will be 4.8%, inflation (as measured by the PCE Deflator) will be 2% and longer run Fed Funds rate will be 3%. Both the GDP and unemployment targets have been attained and the economy is very close to the Fed’s inflation measure.
The current scenario has led some to worry that the Fed will not be hawkish enough in the coming years, perhaps allowing inflation to move to higher levels than intended, thereby prompting faster rate hikes later on. Another argument for raising rates now is that it may provide room for the Fed to cut them in future if an economic slowdown so necessitates.
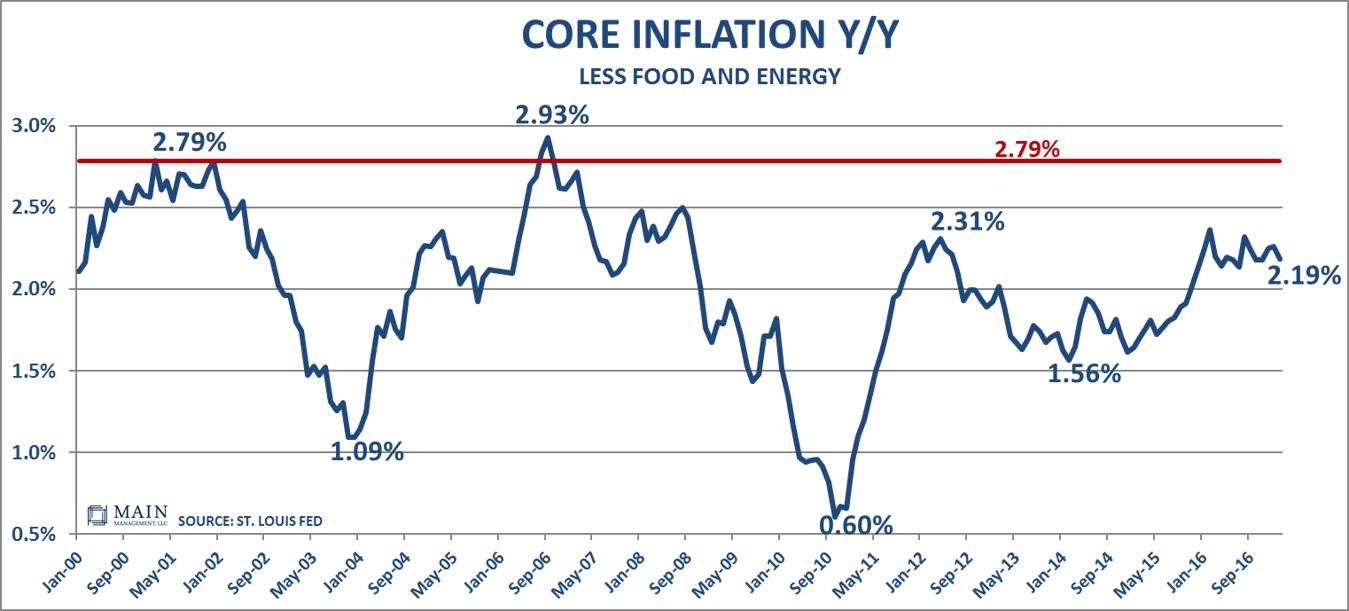
The lack of inflation has been a key reason why the Fed has held off on raising interest rates more aggressively. As a result, Main Management has evaluated a number of different Inflation indicators to obtain a more complete picture. One of them is Core Inflation (less food and energy) which in February came in at 2.19 year over year. The level appears to have flattened out over the past year which may suggest that a more dovish stance towards rates is warranted.
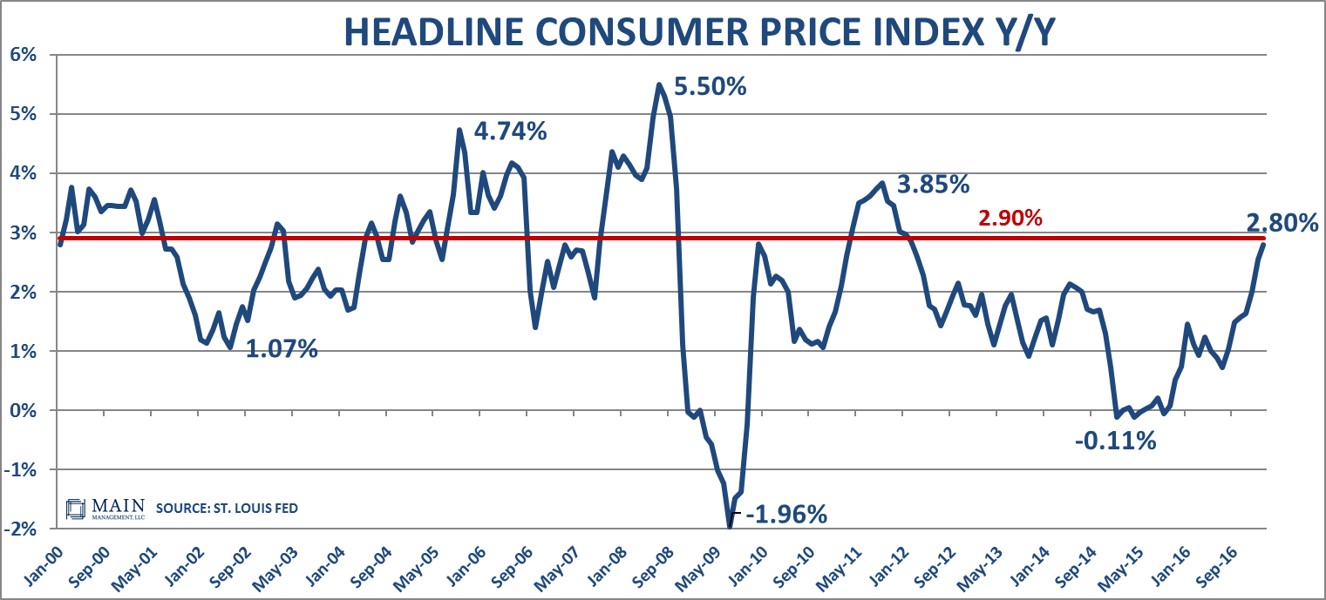
By contrast, the ‘headline’ Consumer Price Index (CPI), which includes both food and energy, showed a more pronounced rise to 2.8% year over year. This is the highest level observed since February 2012. Moreover, it’s getting closer to its median level of 2.9% when we go back to 1948. Given the more dramatic increases in CPI over the past 6 months, a more hawkish stance towards rates increases may make sense.
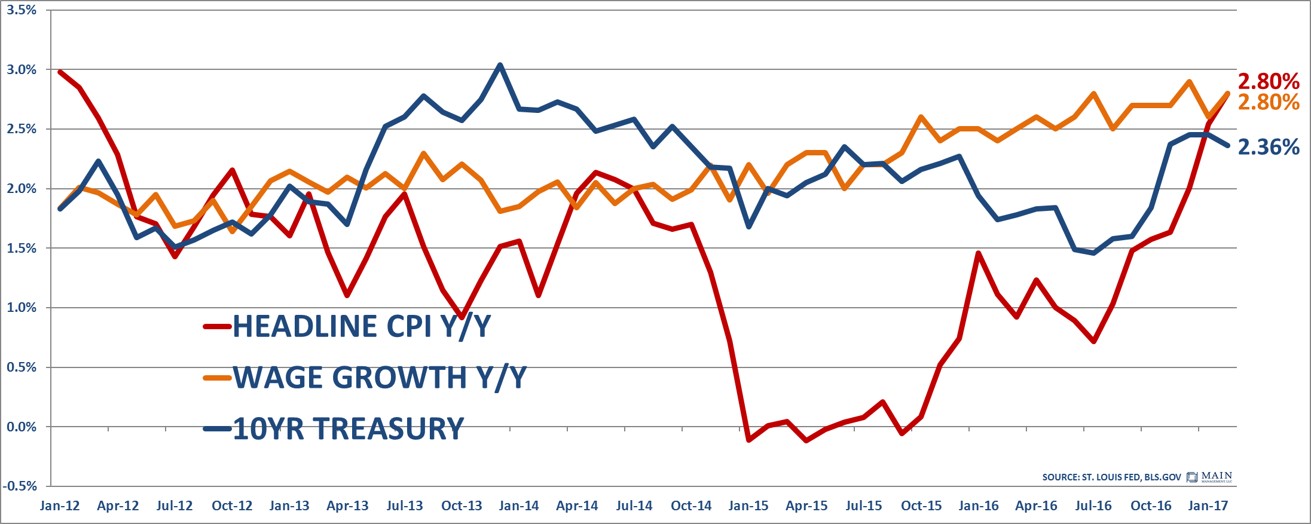
An interesting way of looking at the data may be to assess the CPI alongside wage growth and the yield on the 10-year treasury bond. Typically, when all three are rising, it has been a good indicator of a growing economy. While wage growth has been fairly steady over the past two years, the CPI has had a more noticeable climb, particularly over the past 6 months. The chart below may highlight why the Fed thought now was the time to act decisively, and the 10-year treasury’s recent rise may have been in anticipation of such a move.
As a result, Main Management believes that the Fed’s assessment of rising inflationary pressure is well founded. This is the ‘third leg’ of the Fed’s stated litmus test to determine that the economy is strong enough to warrant interest rate increases. So how might one position an investment portfolio to potentially avail of what may be multiple rate hikes in 2017?
During a rising economy, borrowers generally have an easier time making loan payments and banks tend to have fewer non-performing assets. In addition, banks potentially make more money from the spread between what they pay savers for savings accounts and CDs and what they can earn from making loans. Accordingly, broad based financials (XLF, for example) and perhaps, more narrowly, banks (KBE, for example) may be ETFs to consider.
Historically, the perception has been that rising rates are negative for Emerging Market economies as they increase borrowing costs for such nations. However, there is a very close correlation between the Commodity Research Bureau Spot Market Price Index (CRB Spot) and Emerging Market equity performance. The CRB Spot is a measure of price movements of 22 sensitive basic commodities which are historically among the first to be influenced by changes in economic conditions. The CRB Spot appears to have bottomed in early 2016. As such, Emerging Markets (EEM and VWO for example) may be ETFs that warrant a closer look.
Hafeez Esmail is the Chief Compliance Officer at Main Management, a participant in the ETF Strategist Channel.
A pioneer in managing all-ETF portfolios, Main Management LLC is committed to delivering liquid, transparent and cost-effective investment solutions. By combining asset allocation insights with smart implementation vehicles, Main Management offers a unique approach that translates into distinct advantages for our clients, including diversification, cost efficiency, tax awareness and transparency. For more information, visit http://www.mainmgt.com.