

By Marc Odo, Swan Global Investments
The battle between active and passive management has been raging for years, but in 2016 the momentum was all on the side of passively managed ETFs and mutual funds. BlackRock, Vanguard, and StateStreet occupy the top spots on the AUM tables, each passively managing trillions of dollars.
Meanwhile, traditional stock-picking active managers have been hemorrhaging assets. According to research from Strategic Insight and Goldman Sachs, passive strategies account for nearly 40% of investors’ exposure to US-domiciled equity funds, more than double the level in 2005.
In the face of such an overwhelming trend, it is important to keep in mind passive management is far from riskless. This shift to passive management happened against the backdrop of the second-longest bull market in U.S. history. Since bottoming out in March 2009, the S&P 500 is up over 250% and has set all-time highs.
One of my favorite truths about passive managers is that they “can’t play defense.” Meaning that if and when markets go down, a passive manager will go down in lock-step with its benchmark index. By design a passive manager should track its benchmark as closely as possible. During a bull market, that’s wonderful. It is less appealing to be joined at the hip to the market if it drops 45% or 50%, like it did in the dot-com bust of 2000-02 or the financial crisis of 2007-09, respectively.
How does one measure the risk of a passive manager? Traditional performance metrics like alpha, information ratio, beta, R-squared, and up/down capture are meaningless if the passive ETF or fund tracks its benchmark as intended. All those metrics measure performance on a relative basis. If one is concerned about volatility, then standard deviation and Sharpe ratio are suitable measures for passive managers as well as active managers. However, if one is primarily concerned with capital preservation, a relatively new metric called “the pain index” is worth a closer look.
Developed about a decade ago by Dr. Thomas Becker and Aaron Moore at Zephyr Associates[1], the pain index measures three things:
- The depth of losses
- The duration of losses
- The frequency of losses
The best way to illustrate the pain index is via the chart below.
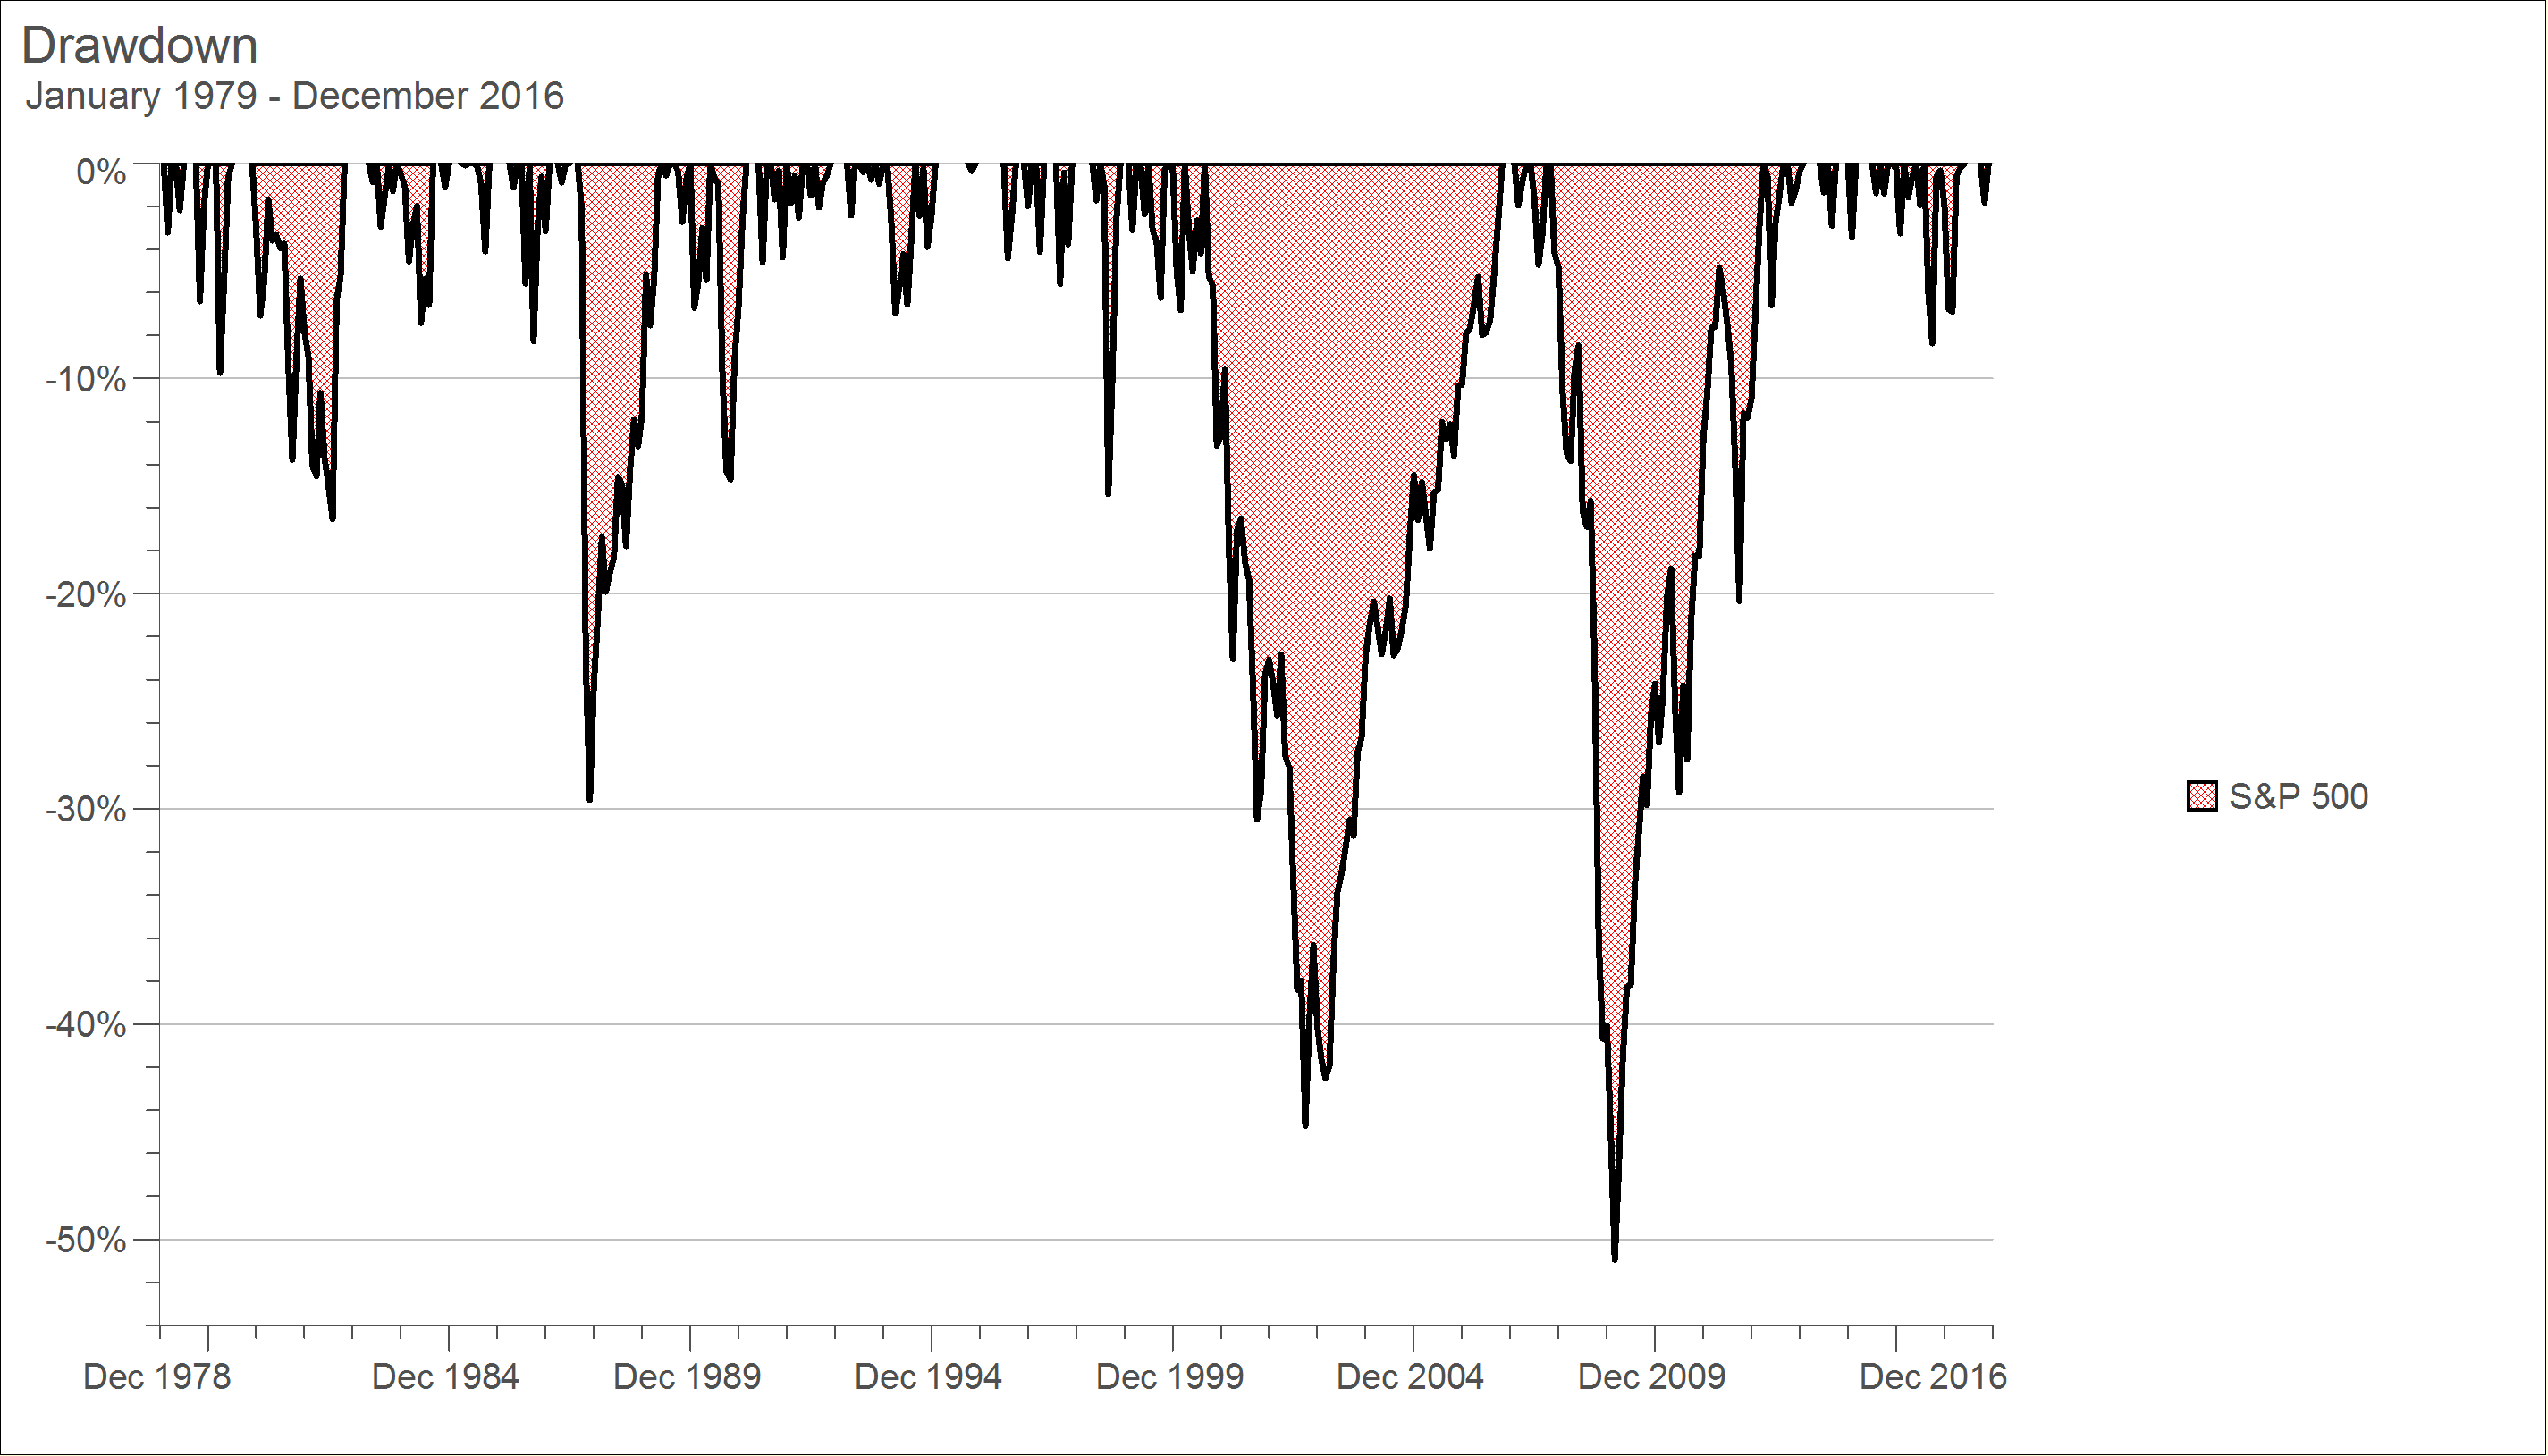
In this chart we see the periods of drawdown for the S&P 500. We see major losses associated with the two great bear markets of the 2000’s. We see how long it took to recover. We see smaller, secondary losses associated with the early 1980’s recession, Black Monday in 1987, the 1990-91 recession, and a short, sharp spike in 1998 signifying the Long Term Credit Management debacle.
If one were to fill in all of this area in red between the break-even line and the drawdown line, the drawdown area is what we hope to minimize. The pain index measures this area. We don’t want to experience steep losses. We don’t want to remain underwater for extended periods of time. We don’t want to go through multiple periods of loss. By using the pain index, we get a complete picture of historical losses. Investors tend to make poor decisions after losing money, investments with a low pain index should minimize the self-destructive temptation to “sell low, buy high.”
The pain index is a vast improvement on maximum drawdown, which is a common measure of capital preservation. Maximum drawdown is defined as the peak-to-trough loss on an investment, but it only measures one dimension on the above graph. Maximum drawdown doesn’t tell us how long it took to recover our losses. Maximum drawdown doesn’t account for the smaller, secondary losses. An investment with an inception date post-March 2009 will have a very different maximum drawdown than one that experienced the financial crisis.
People frequently ask, “What is a ‘good’ pain index? What number should I look for?” Obviously the smaller the pain index the better. We want that area of loss to be minimized. As far as a concrete number is concerned, I like to answer that question by drawing an analogy to standard deviation. What is a good standard deviation? It depends. It depends a lot upon the asset class. Obviously asset classes like investment grade bonds will have a small pain index, since they rarely lose money. Conversely, asset classes like emerging markets will have a larger pain index since they occasionally experience significant sell-offs.
In the table below, we have indices representing many of the major asset classes, and the corresponding pain index and standard deviation for each. Also on this table is Swan Global Investment’s Defined Risk Strategy.
| Asset Class | Return | Standard Deviation | Pain Index | |
| Hedged Equity | Swan DRS (net) | 8.53% | 9.65% | 2.32% |
| U.S. Large Cap Stock | S&P 500 | 6.85% | 15.27% | 12.03% |
| U.S. Small Cap Stock | Russell 2000 | 7.93% | 20.13% | 10.23% |
| Foreign Developed | MSCI EAFE | 4.13% | 17.03% | 15.98% |
| Foreign Emerging | MSCI EM | 4.99% | 24.04% | 19.87% |
| U.S. Invest Grade Bond | Barclays U.S. Aggregate | 5.26% | 3.46% | 0.58% |
| U.S. High Yield Bond | Barclays U.S. Corp. High Yield | 6.90% | 9.27% | 2.50% |
| Commodities | S&P GSCI | -1.49% | 23.08% | 34.31% |
| Real Estate | FTSE Nareit All REITs | 9.05% | 19.82% | 11.72% |
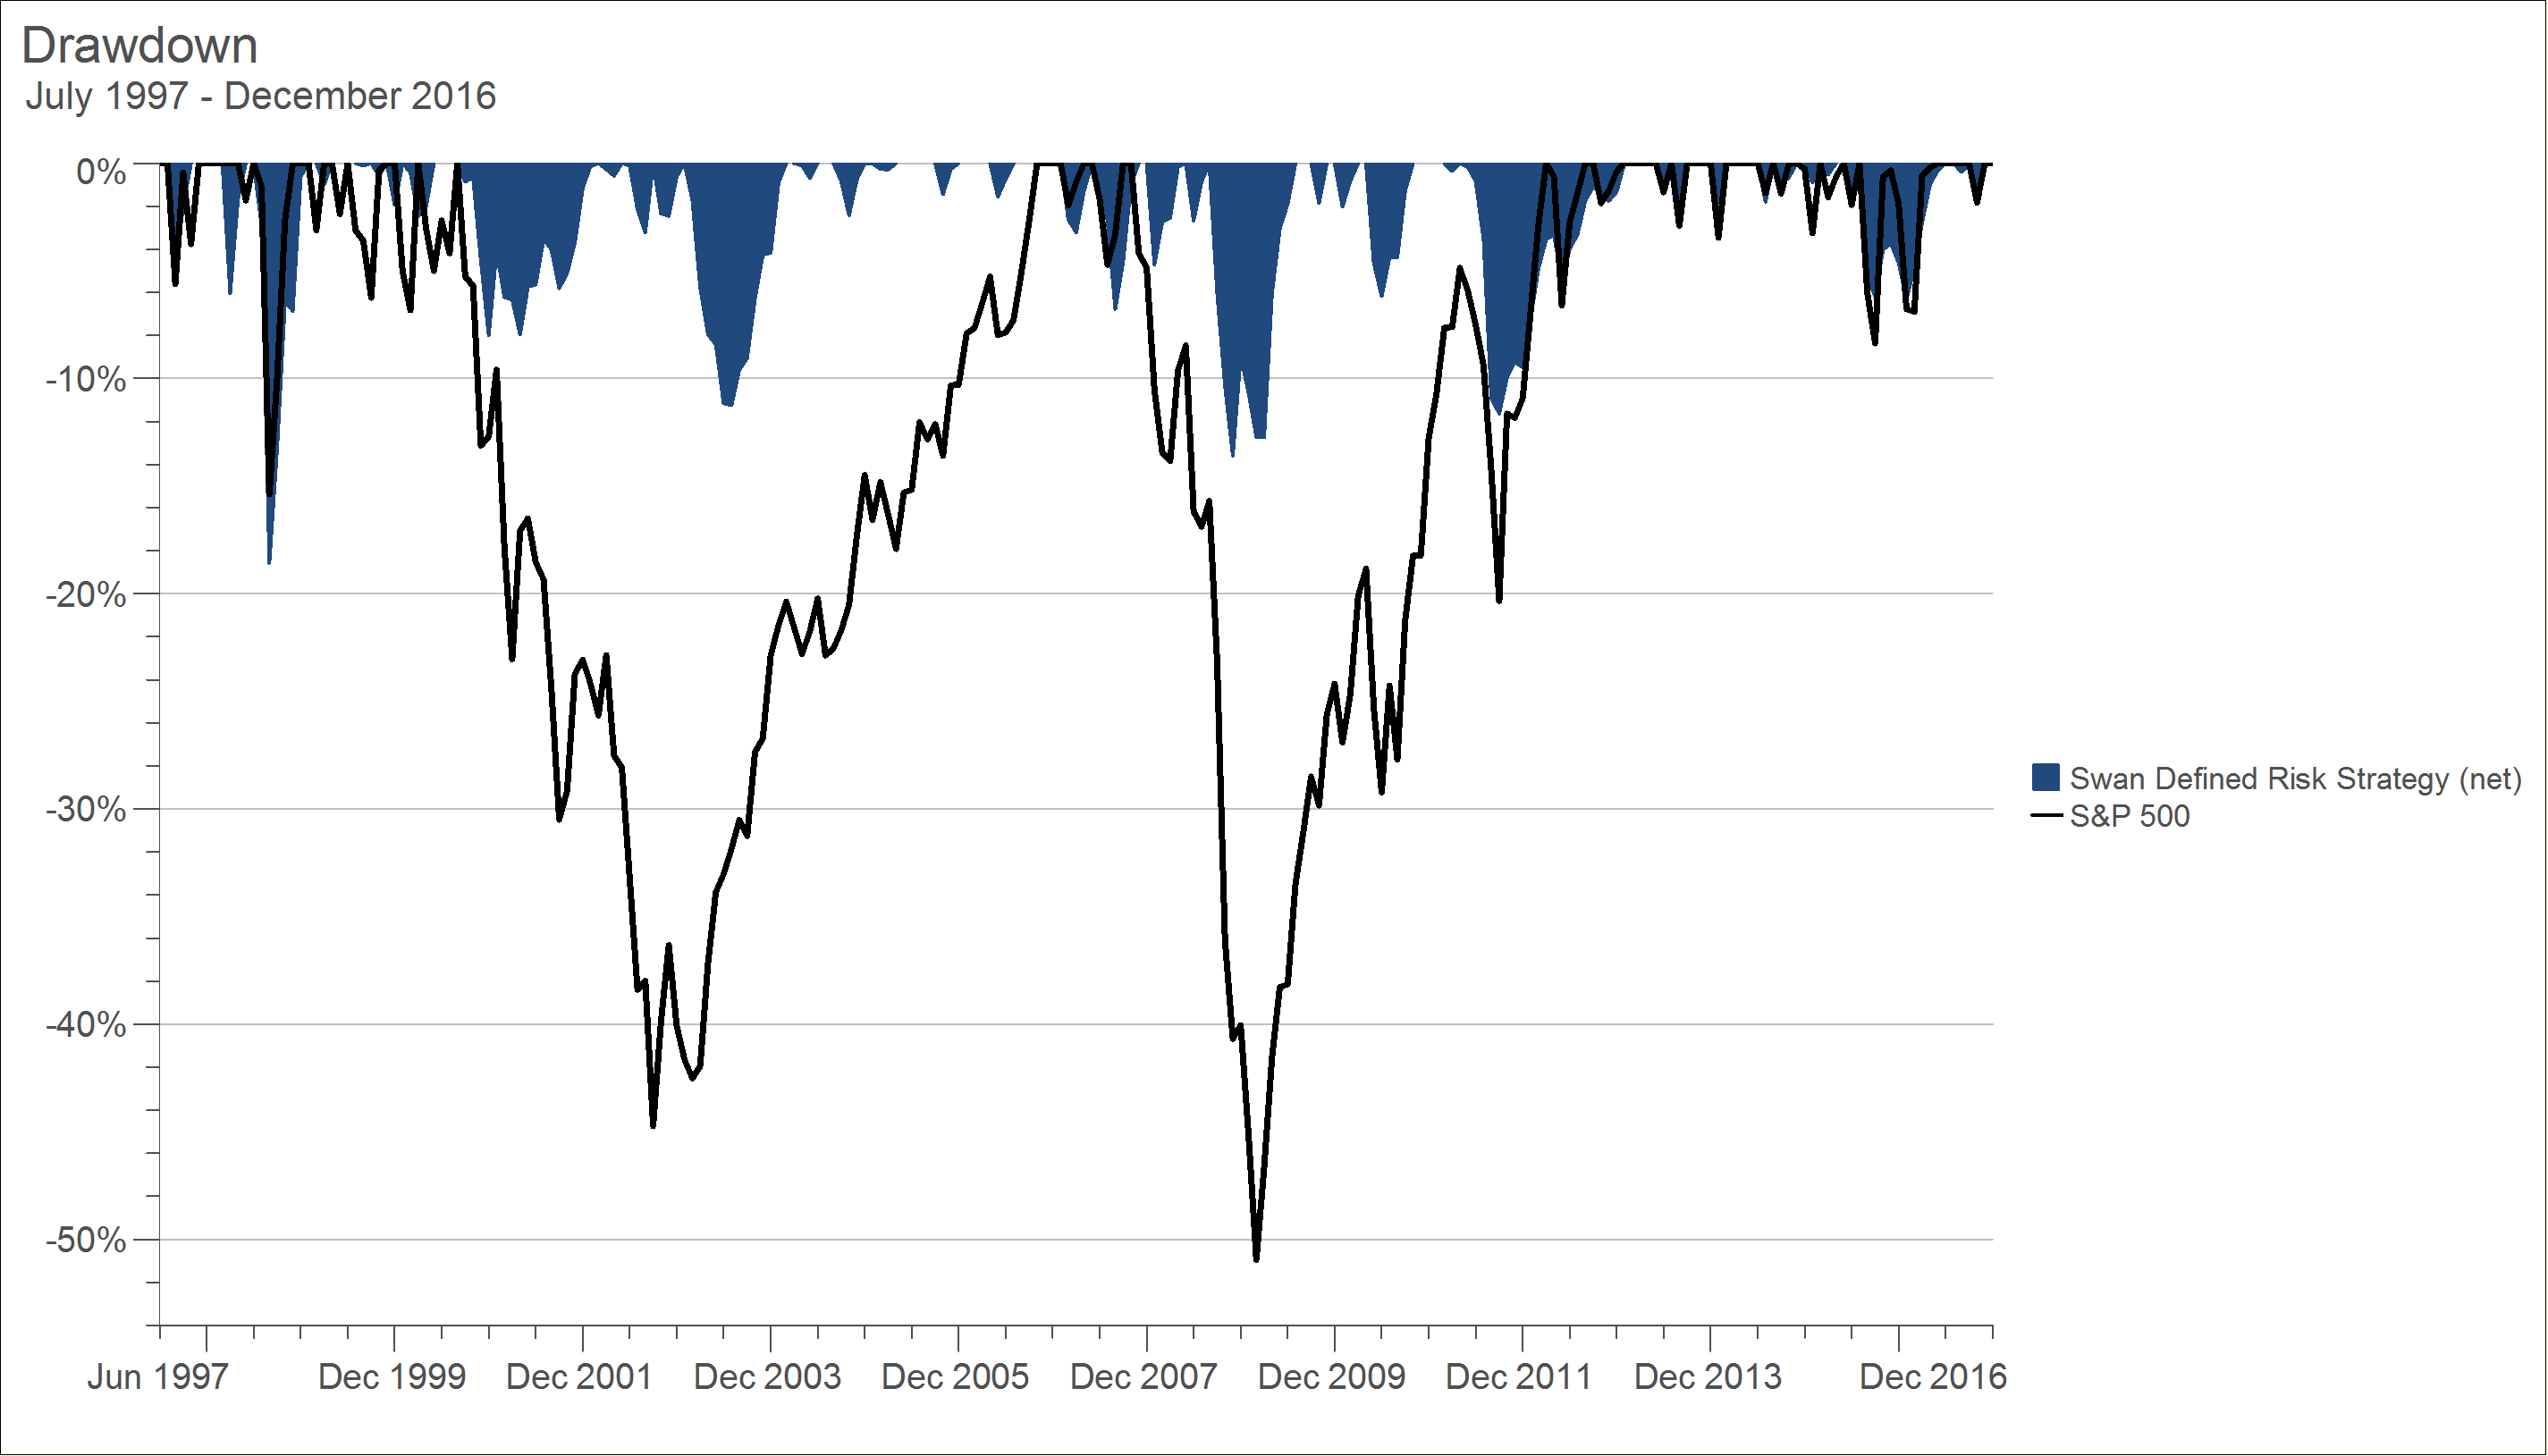
For nearly 20 years, Swan Global Investments has managed the Defined Risk Strategy (DRS) with the explicit purpose of minimizing the depth, duration, and frequency of losses. By combining ETFs with the intelligent and efficient use of options, the DRS has been able to mitigate the impact of losses without sacrificing too much of the upside. The graph below illustrates how the DRS was able to successfully weather the two major bear markets of the new millennium and generate a pain index roughly 1/5th of that of the S&P 500.
There are many different ways to measure risk. For passive managers, benchmark-relative measures are useless, since a passive manager is essentially the benchmark. If one is concerned with volatility, then standard deviation and the Sharpe ratio are useful metrics. But if one believes that the real risk in any investment is capital preservation risk, then the pain index serves as a useful addition in the analyst’s toolbox.
Marc Odo is the Director of Investment Solutions at Swan Global Investments, a participant in the ETF Strategist Channel.
[1] Full disclosure: From 2003 to 2014 I was the Director of Research at Zephyr Associates and had the pleasure of working alongside Dr. Becker and Aaron Moore.
Disclosure Information
Swan Global Investments, LLC is a SEC registered Investment Advisor that specializes in managing money using the proprietary Defined Risk Strategy (“DRS”). SEC registration does not denote any special training or qualification conferred by the SEC. Swan Global Investments offers and manages the Defined Risk Strategy for investors including individuals, institutions and other investment advisor firms. All Swan products utilize the Swan DRS but may vary by asset class, regulatory offering type, etc. Accordingly, all Swan DRS product offerings will have different performance results and comparing results among the Swan products and composites may be of limited use. Swan claims compliance with the Global Investment Performance Standards (GIPS®). Any historical numbers, awards and recognitions presented are based on the performance of a (GIPS®) composite, Swan’s DRS Select Composite, which includes nonqualified discretionary accounts invested in since inception, July 1997 and are net of fees and expenses. All data used herein; including the statistical information, verification and performance reports are available upon request. The S&P 500 Index is a market cap weighted index of 500 widely held stocks often used as a proxy for the overall U.S. equity market. Indexes are unmanaged and have no fees or expenses. An investment cannot be made directly in an index. Swan’s investments may consist of securities which vary significantly from those in the benchmark indexes listed above and performance calculation methods may not be entirely comparable. Accordingly, comparing results shown to those of such indexes may be of limited use. The adviser’s dependence on its DRS process and judgments about the attractiveness, value and potential appreciation of particular ETFs and options in which the adviser invests or writes may prove to be incorrect and may not produce the desired results. There is no guarantee any investment or the DRS will meet its objectives. All investments involve the risk of potential investment losses as well as the potential for investment gains. Prior performance is not a guarantee of future results and there can be no assurance, and investors should not assume, that future performance will be comparable to past performance. All investment strategies have the potential for profit or loss. Further information is available upon request by contacting the company directly at 970.382.8901 or visit swanglobalinvestments.com.