Assessing sector performance, jobs demographics, manufacturing and consumption trends
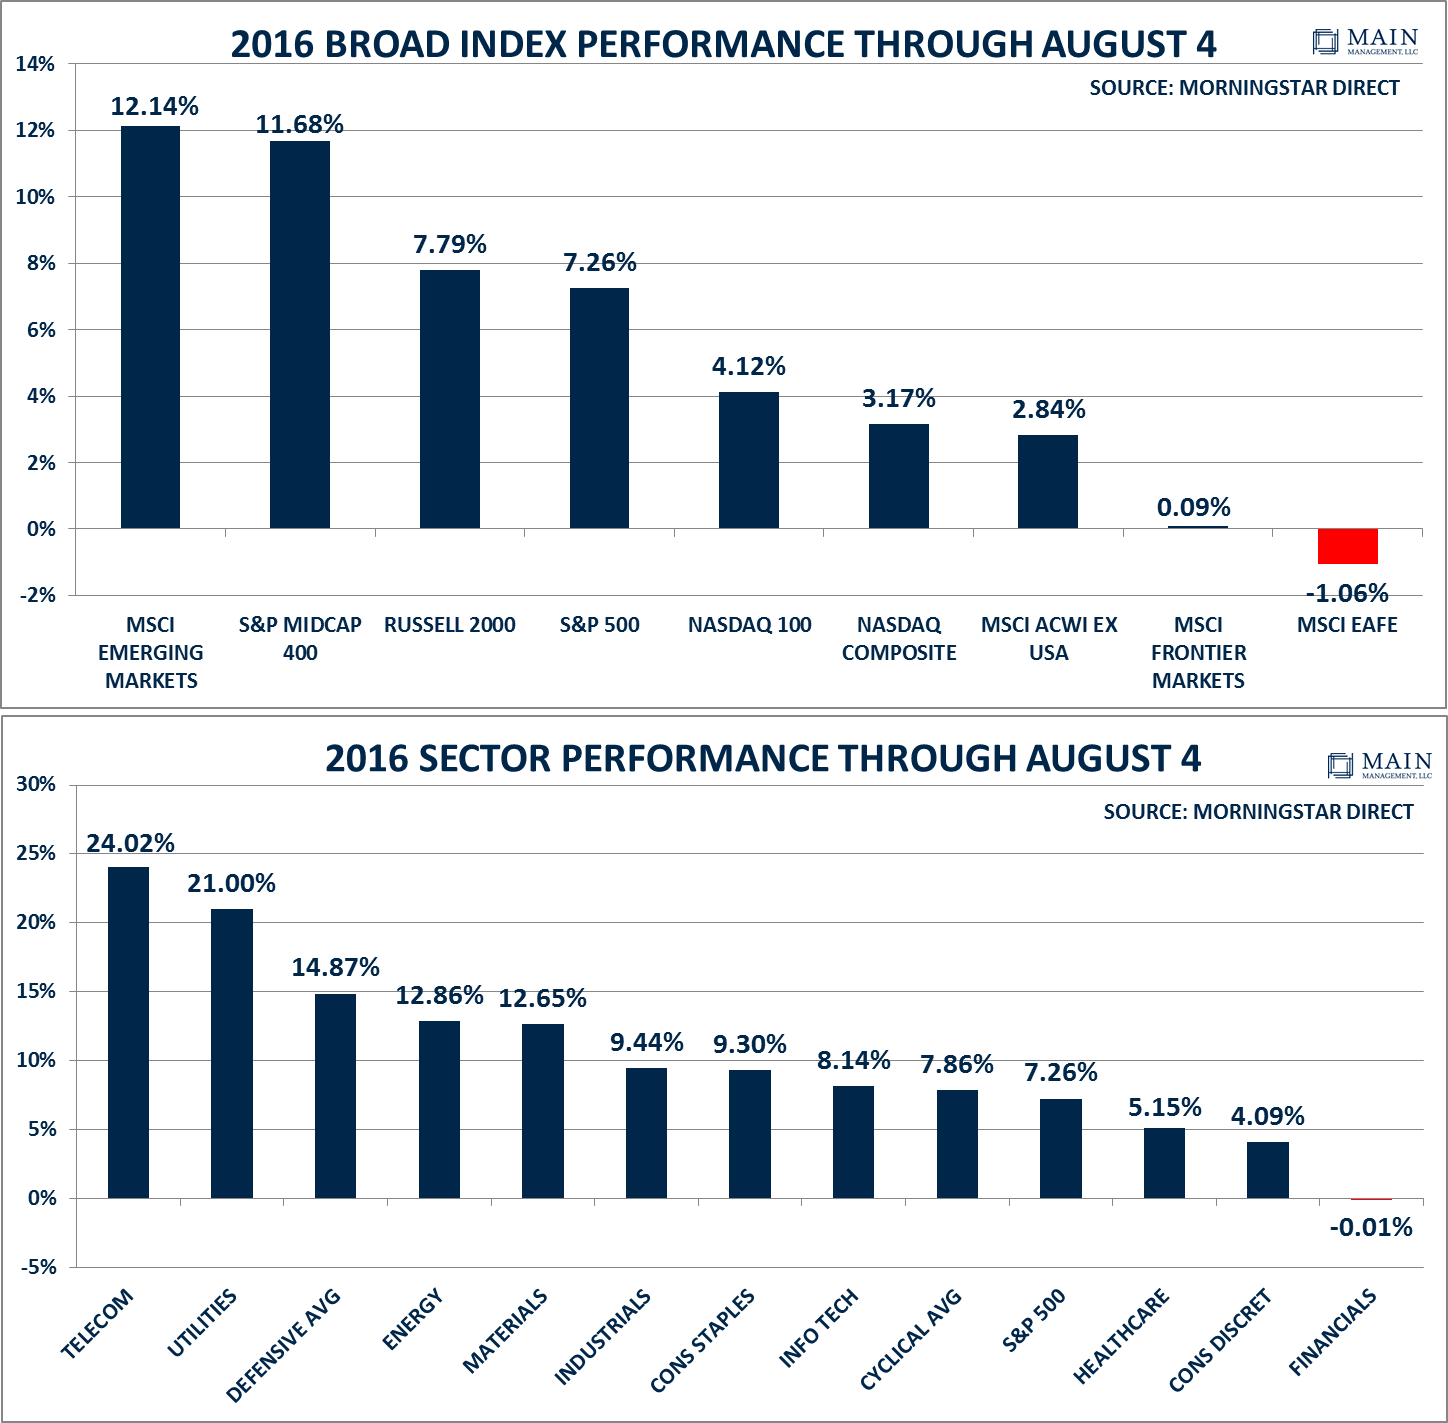
As investors reflect on 2016 to date it may be best described as one lacking consensus on the strength of both the US and Global Economy. On the one hand, the leading broad market has been Emerging Markets at 12.14%, followed by Mid-Cap and Small Cap Indexes at 11.84% and 7.79%, respectively, year to date through Aug. 4, 2016. This would suggest a “Risk-On” environment where investors feel that overall investment conditions are favorable and thus gravitate towards higher-risk instruments.
On the other hand, the sector performance among S&P 500 stocks paints a very different picture. Telecom (24.02%) and Utilities (21.0%) are considered more defensive sectors but lead the way in terms of YTD performance. The average of defensive sectors (14.87%) is decidedly ahead of the overall S&P 500 (7.26%) through Aug. 4 2016, suggesting investors have gravitated towards lower risk/higher yield investments. Moreover gold, traditionally a safe haven during crisis periods, is up 28.6% over the same time frame.
Click the chart to enlarge:
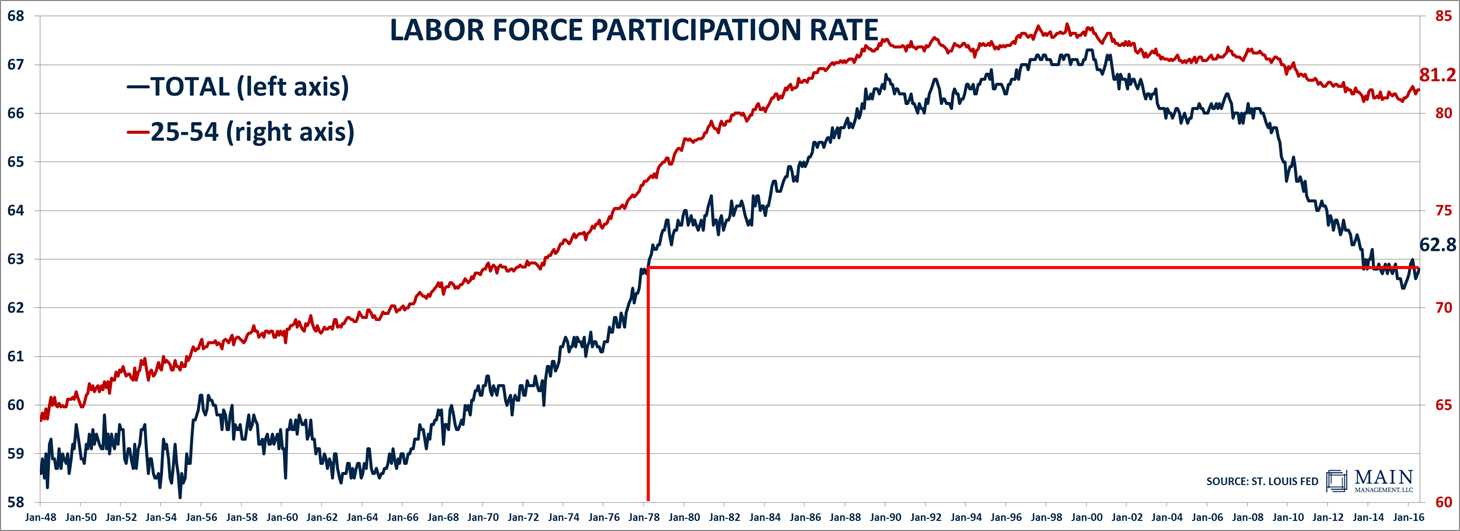
To tie in with our recent article on global demographic changes and impacts (Vanishing Sovereign Bond Yields Around the Developed World) it may be worth examining the BLS report through this lens. In July the U.S. economy added 255,000 jobs, handily beating consensus estimates. The Labor Force Participation rate increased by 407,000 people in July to attain a level of 62.8%. This is 0.3% higher than the level of July 2015, but significantly below the 66.1% participation rate of July 2008.
As mentioned in our previous article, the approximately 14 million people that have exited the U.S. job market closely correlates with the earliest Baby Boomers becoming eligible for Social Security and Medicare benefits. The chart below tracks the Labor Force participation rate since the start of the Baby Boomer generation, commencing at a level of 58.6% in January 1948 and peaking at a level of 67.3% around March 2000, the peak of the Tech Boom/Bubble.
Click the chart to enlarge: