

Note: This article appears on the ETFtrends.com Strategist Channel
By Scott Kubie, CFA, CLS Chief Strategist
Market bubbles occur when the price of an asset significantly deviates from its intrinsic value. There have been numerous bubbles predicted in my 20 years as a professional investor. Fortunately, only two, from the perspective of U.S. investors, came to pass. The technology bubble in 2000 and the financial crisis in 2008.
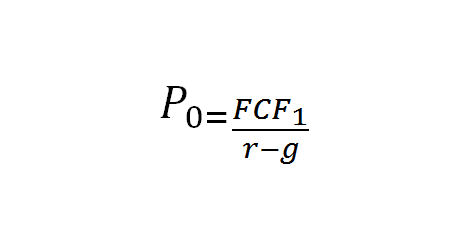
Bubbles are hard to identify until they occur. Let’s look at this equation:
It offers a way to identify the next bubble: understand how previous bubbles formed. Before expanding that thought, a little about the equation. P0 represents the fair price or intrinsic value. It is a function of three variables:
- Free cash flow (FCF) one year in the future
- The required rate of return (r in this equation, although k is sometimes used)
- The future growth rate (g in this equation)
Whether you totally grasp the equation or not, the key points are: higher cash flow and growth raise the value of the firm, and a higher required rate of return lowers the value. The last two U.S. market bubbles occurred because investors were fooled by inflated values in one of these numbers.
[related_stories]Interestingly, the 2000 and 2008 bubbles occurred in different parts of the equation. In 2000, investors assumed Internet companies would take over every aspect of commerce. Small startups were projected to grow into behemoths down the road. The growth rates assumed far outpaced potential, and a bubble ensued. High price-earnings (P/E) ratios for technology stocks were an expression of high growth expectations. As growth (g) gets closer to the required rate of return (r), valuations can get very high.