- Nearly $20 billion per month flowed into ETFs in 2015
- ETFs are still only a dent in the roughly $16 trillion mutual fund industry
- ETFs continue to have lower expenses, tax efficiency, more transparency
- ETFs have managed to outperform by roughly the typical mutual fund fee for the past three, five and 10 years
- ETFs are outpacing mutual funds in three-year performance in all of the largest categories except world stock
The dramatic growth of ETFs and the continued gains in market share have been well documented and communicated. But there are a variety of trends within the growth of the overall ETF market that are worth exploring in more detail. These trends can undoubtedly inform the past, but they can also help investors clue into where the market is headed and what may be expected in the future.
How Much Money is Flowing into ETFs?
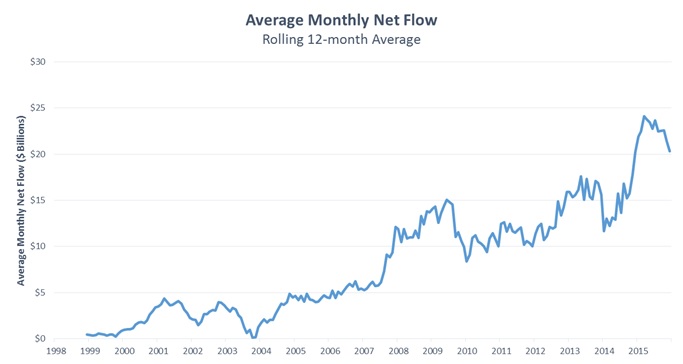
Not only have the overall assets under management (AUM) of the ETF industry been rising, average monthly flows continue to rise.
In 2015, nearly $20 billion per month flowed into ETFs, or 1% of total ETF AUM. The pace of overall flows into ETFs has slowed since the rapid growth stage; however, it has steadied at the 1% monthly level we saw last year. At a continued 1% pace of inflows and 5% market appreciation across ETFs, we can reach $3 trillion within the next seven years.
While still impressive growth, it barely makes a dent in the roughly $16 trillion mutual fund industry. However, as smaller mutual fund companies begin to issue ETFs the likelihood of transition seems much higher. The impact of exchange-traded managed funds (ETMFs) is uncertain but could potentially turn the ETF versus mutual fund composition on its head.
Where is the Money Flowing?
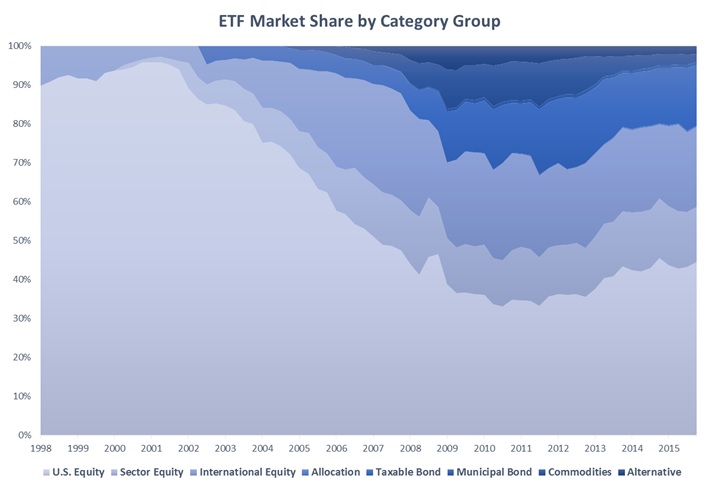
The early years of ETFs were dominated by pure-beta names that tracked major market indices here in the U.S. and select countries. The overall market share of the international and sector-focused funds stagnated until the fallout of the tech bubble, and from there sector ETFs and international ETFs soared. Growth rates through the mid-2000s, while helped by a strengthening global economy, were extreme. Post financial crises, other categories of ETFs have picked up steam, mainly fixed-income ETFs. As more and more people retire, it will be interesting to see if worries about interest rates can outweigh the continued flow of capital into fixed income.
Why are ETFs Experiencing Such Strong Growth?
The benefits of ETFs are well known to users of ETFs: lower expenses, tax efficiency, more transparency, and intra-day tradability amongst others.
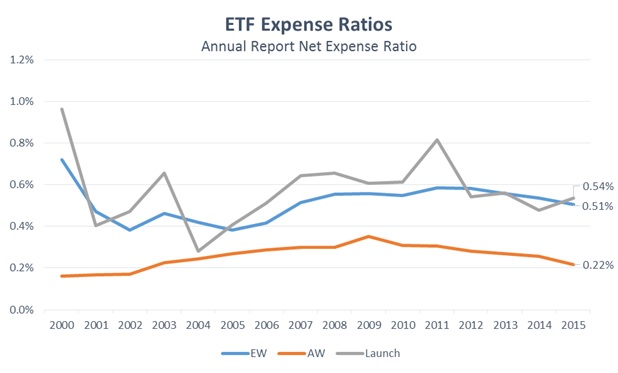
Expenses may be one of the most significant benefits, and they continue to lower across the investing universe. Interestingly, both the equal- and asset-weighted (EW and AW) expense ratios of ETFs rose through the 2000s, peaked a couple of years ago, and have since fallen.
Initial market share was dominated by index names that are very inexpensive, but as more ETFs were launched at higher prices, these overall expenses crept higher. This troughed in 2004 with the introduction of Vanguard into the ETF world and peaked in 2011 when a substantial amount of inverse and levered ETFs were launched with high expenses.
In fact, in 2011, the average expense ratio of a newly launched ETF was 0.80%. Fee competition in some of the largest ETFs has reduced overall costs in recent years.
It should be noted, however, that last year the average new ETF was launched at a higher cost than the average of all existing funds. Going forward, competition will ultimately push fees lower. Even smart/strategic beta products are already seeing decreased fees and competition from new providers at low costs.