

- Since dividend ETFs are comprised of a basket of companies, its portfolio composition determines its quality
- Dividend cuts are often signals of underlying profitability or operational issues
- Variations in quality exposure are consistent with the index methodology used by each ETF
In the bond world, lower quality bonds come with higher yields as investors demand a premium for the risk of default. Simple enough.
While this inverse relationship does not hold as strictly for equities, the quality of a company still has a bearing on its ability to maintain a dividend going forward. Dividend cuts are often signals of underlying profitability or operational issues. Suddenly, you are not only losing out of the income you thought you would earn, but your capital base is now at an increased risk of loss.
Since dividend ETFs are comprised of a basket of companies, its portfolio composition determines its quality. As is typical, we can evaluate “quality” of an ETF’s portfolio by using a factor model, the most well known of which is the Fama-French 3-Factor Model. In this model, Fama and French consider three factors: market, value, and size. To tailor this for our use, we will add the quality factor (quality-minus-junk, QMJ), which is published by AQR.
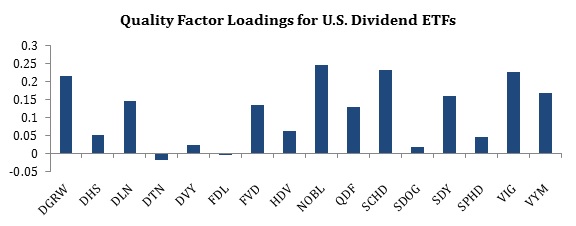
The chart below shows the average quality factor loading of 16 U.S. dividend ETFs over the period for which data is available for all tickers and factors (October 2013 – November 2015).
Source: Yahoo! Finance, AQR, Newfound Research. All ETFs have over $500M AUM.
The exposure to the quality factor varies significantly. In fact, the variations in quality exposure are consistent with the index methodology used by each ETF. For instance:
- DGRW applies a quality screen
- NOBL and VIG invests in companies that have consistently increased their dividends
- VYM and SCHD avoid REITs, which are often higher yielding but lower quality
- SDY focuses on high yield but in the context of companies that have consistently grown their dividends.
Many of these ETFs also weight their holdings relative to some quality screen metric. Contrast this with FDL (essentially 0 quality factor loading) that weights its holdings based on their yield.
Historically, high quality stocks have outperformed low quality stocks by a significant margin. If we are more concerned about long only portfolios, as is generally the case with factor ETFs, high quality stocks have outperformed the market by 170 bps annually.
As with all alpha, harvesting this premium comes with many bumps in the road.
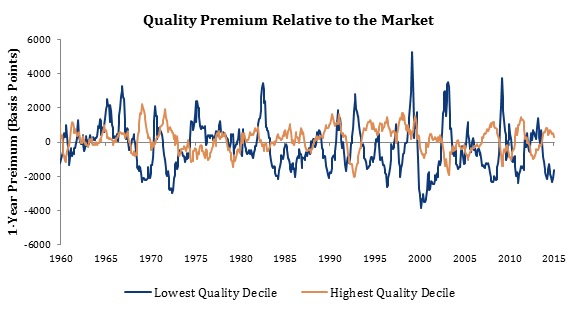
Source: AQR, Newfound Research