Since 2008, the Federal Open Market Committee (FOMC) has maintained one of the most accommodating monetary policies since the Federal Reserve Board began open market operations in the 1920’s. The present low-rate environment has contributed to the third-longest bull market in the S&P 500 Index’s history. Near-zero interest rates from multiple rounds of Quantitative Easing have facilitated relatively rich domestic valuations, although we have concerns surrounding the impact of sustaining such a low-rate regime.
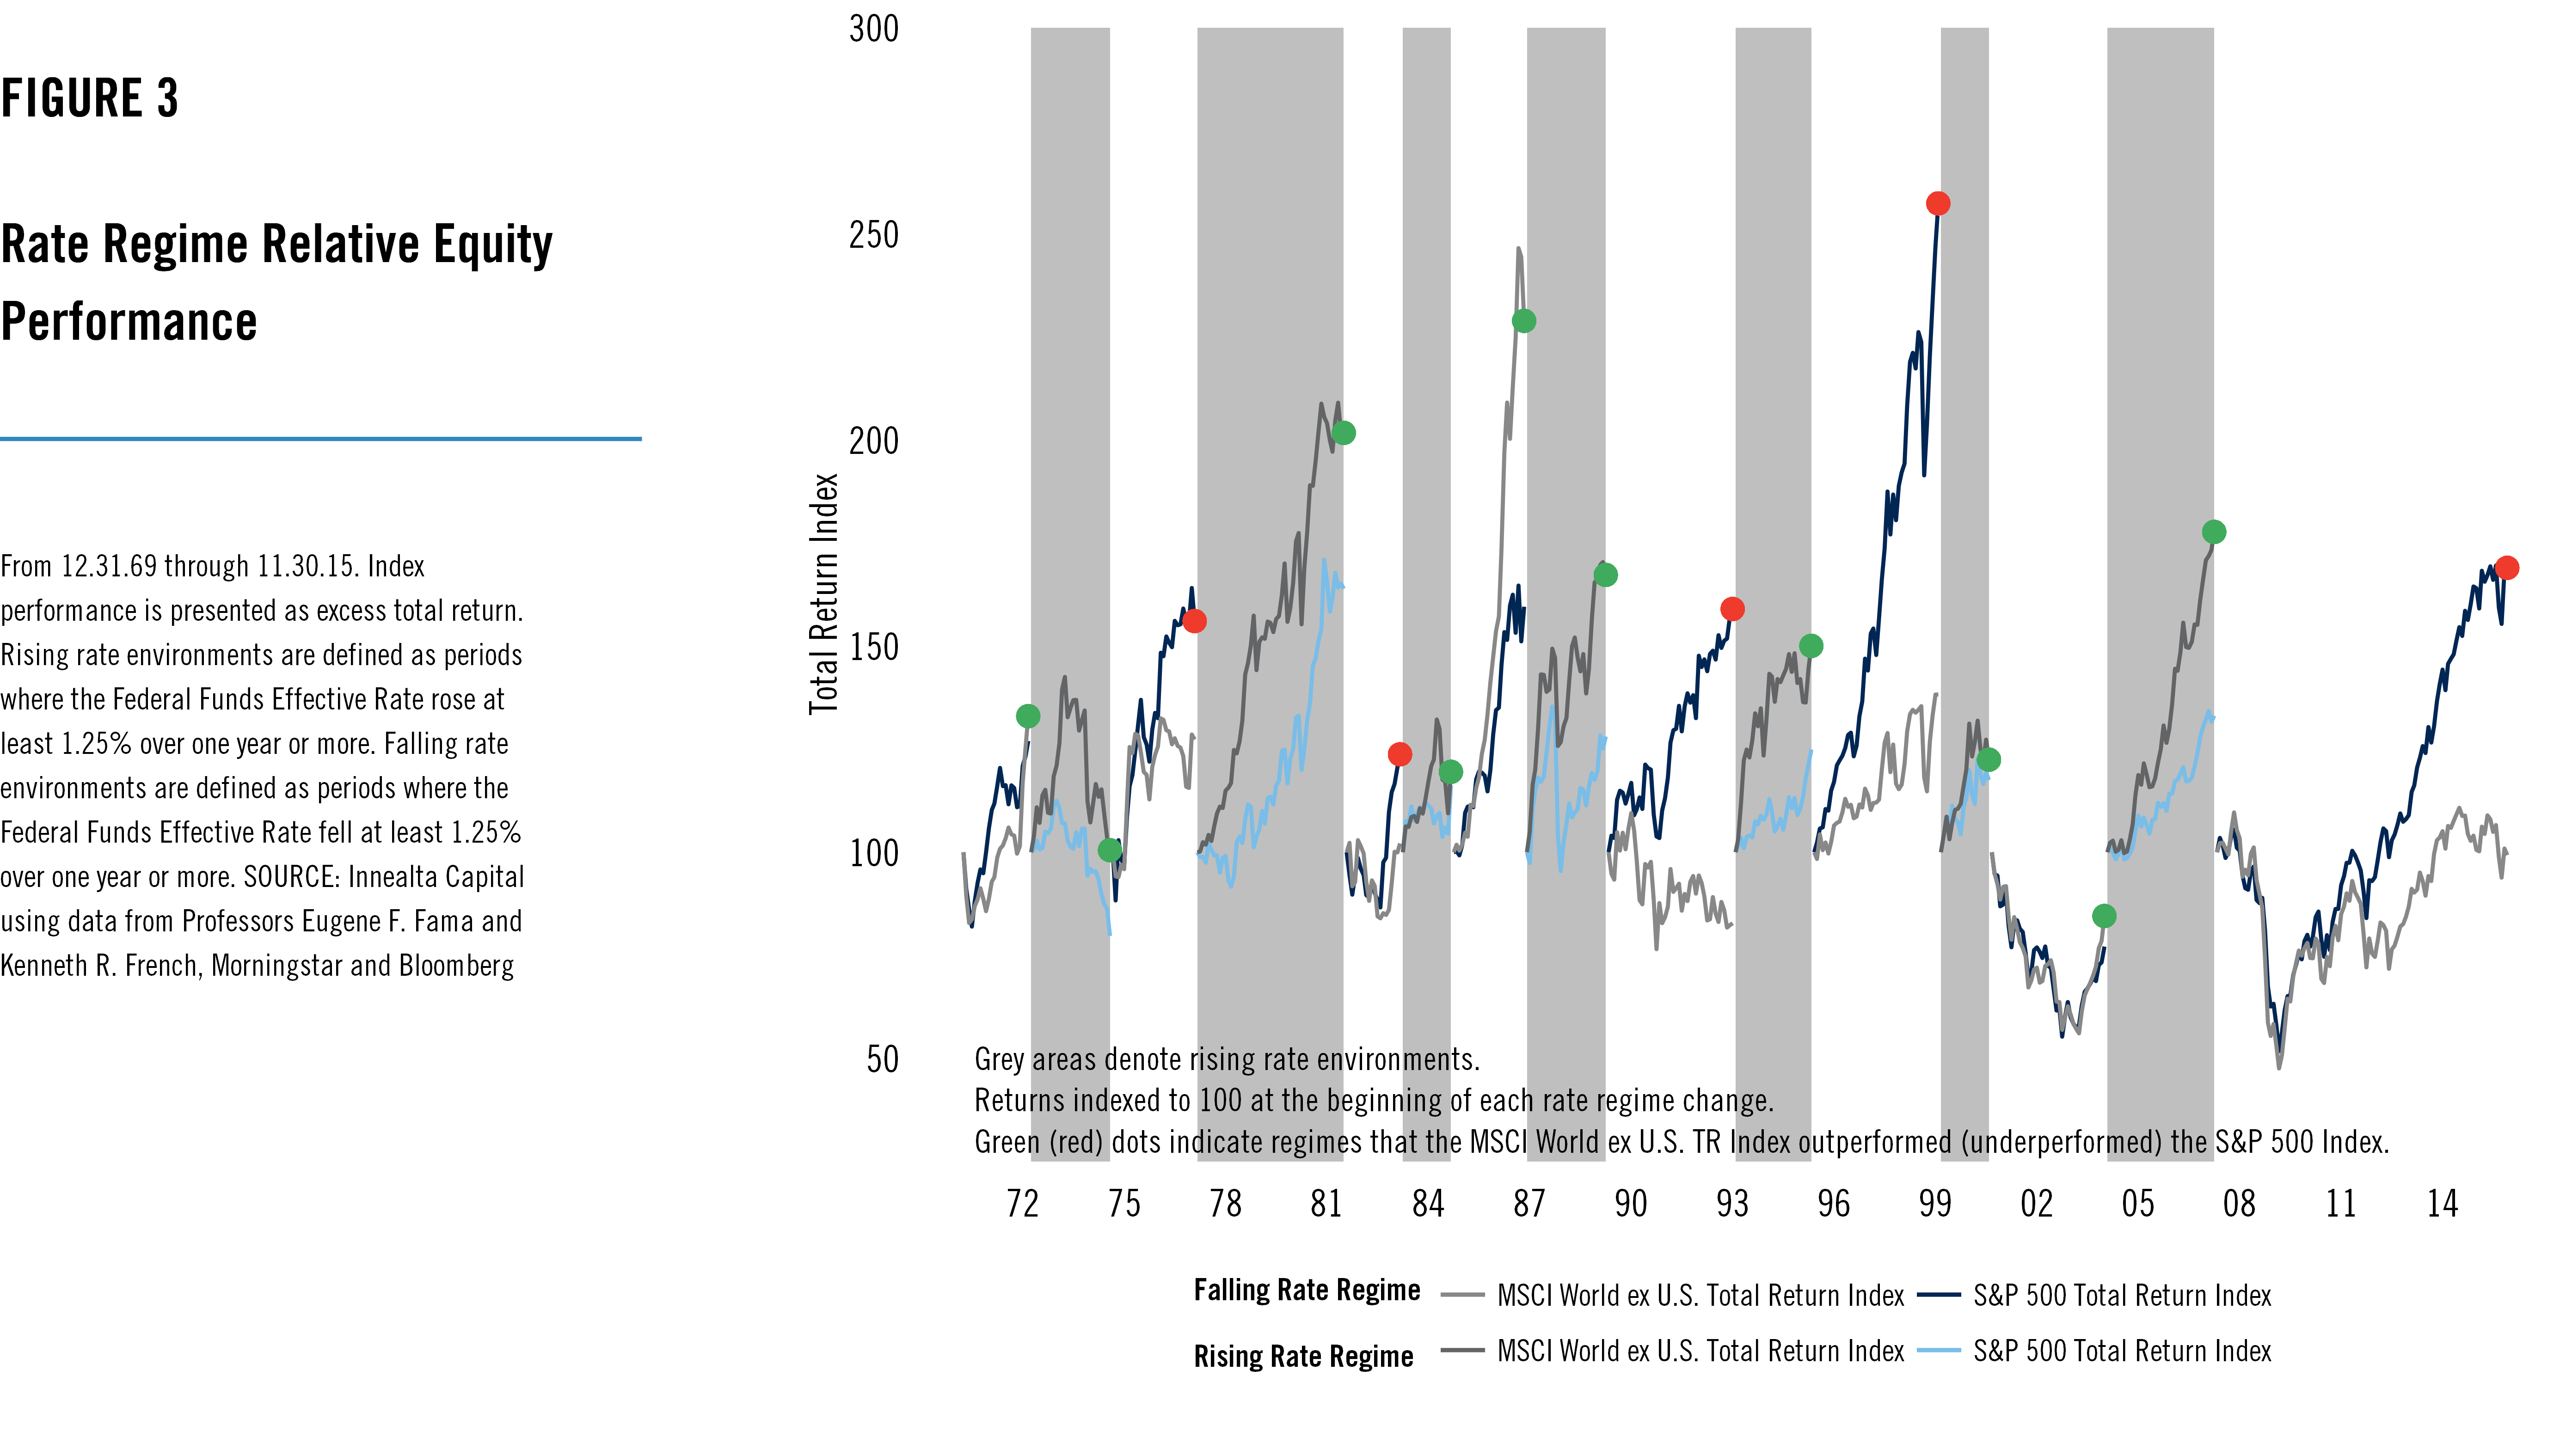
The Fed’s accommodative stance has been one of the contributing factors that pushed the S&P 500 index higher since the FOMC began the first round of Quantitative Easing in late 2008. The QE programs enabled the Fed to address multiple issues facing our economy at the time. By injecting the system with cash, the Fed intended to encourage banks to issue more loans. In the short-term, it would seem that this action helped stimulate the economy by increasing stock prices. However, the jury is still out on whether the net effects of QE were beneficial for the long run. Whether or not you agree with the FOMC’s accommodative policy, one thing is certain: the Fed’s current target rate of 0% – 0.25% has little-to-no wiggle room to further its accommodative stance, unless they intend to press into the uncharted territory of negative interest rates.
In this study we review the effects of rising interest rates on equity markets and identify trends in international equity markets during periods of rising domestic interest rates. While rising interest rate environments are often associated with an improving economy, the knock-on effects, initiated by our Central Bank, can be less clear for international equity market performance.
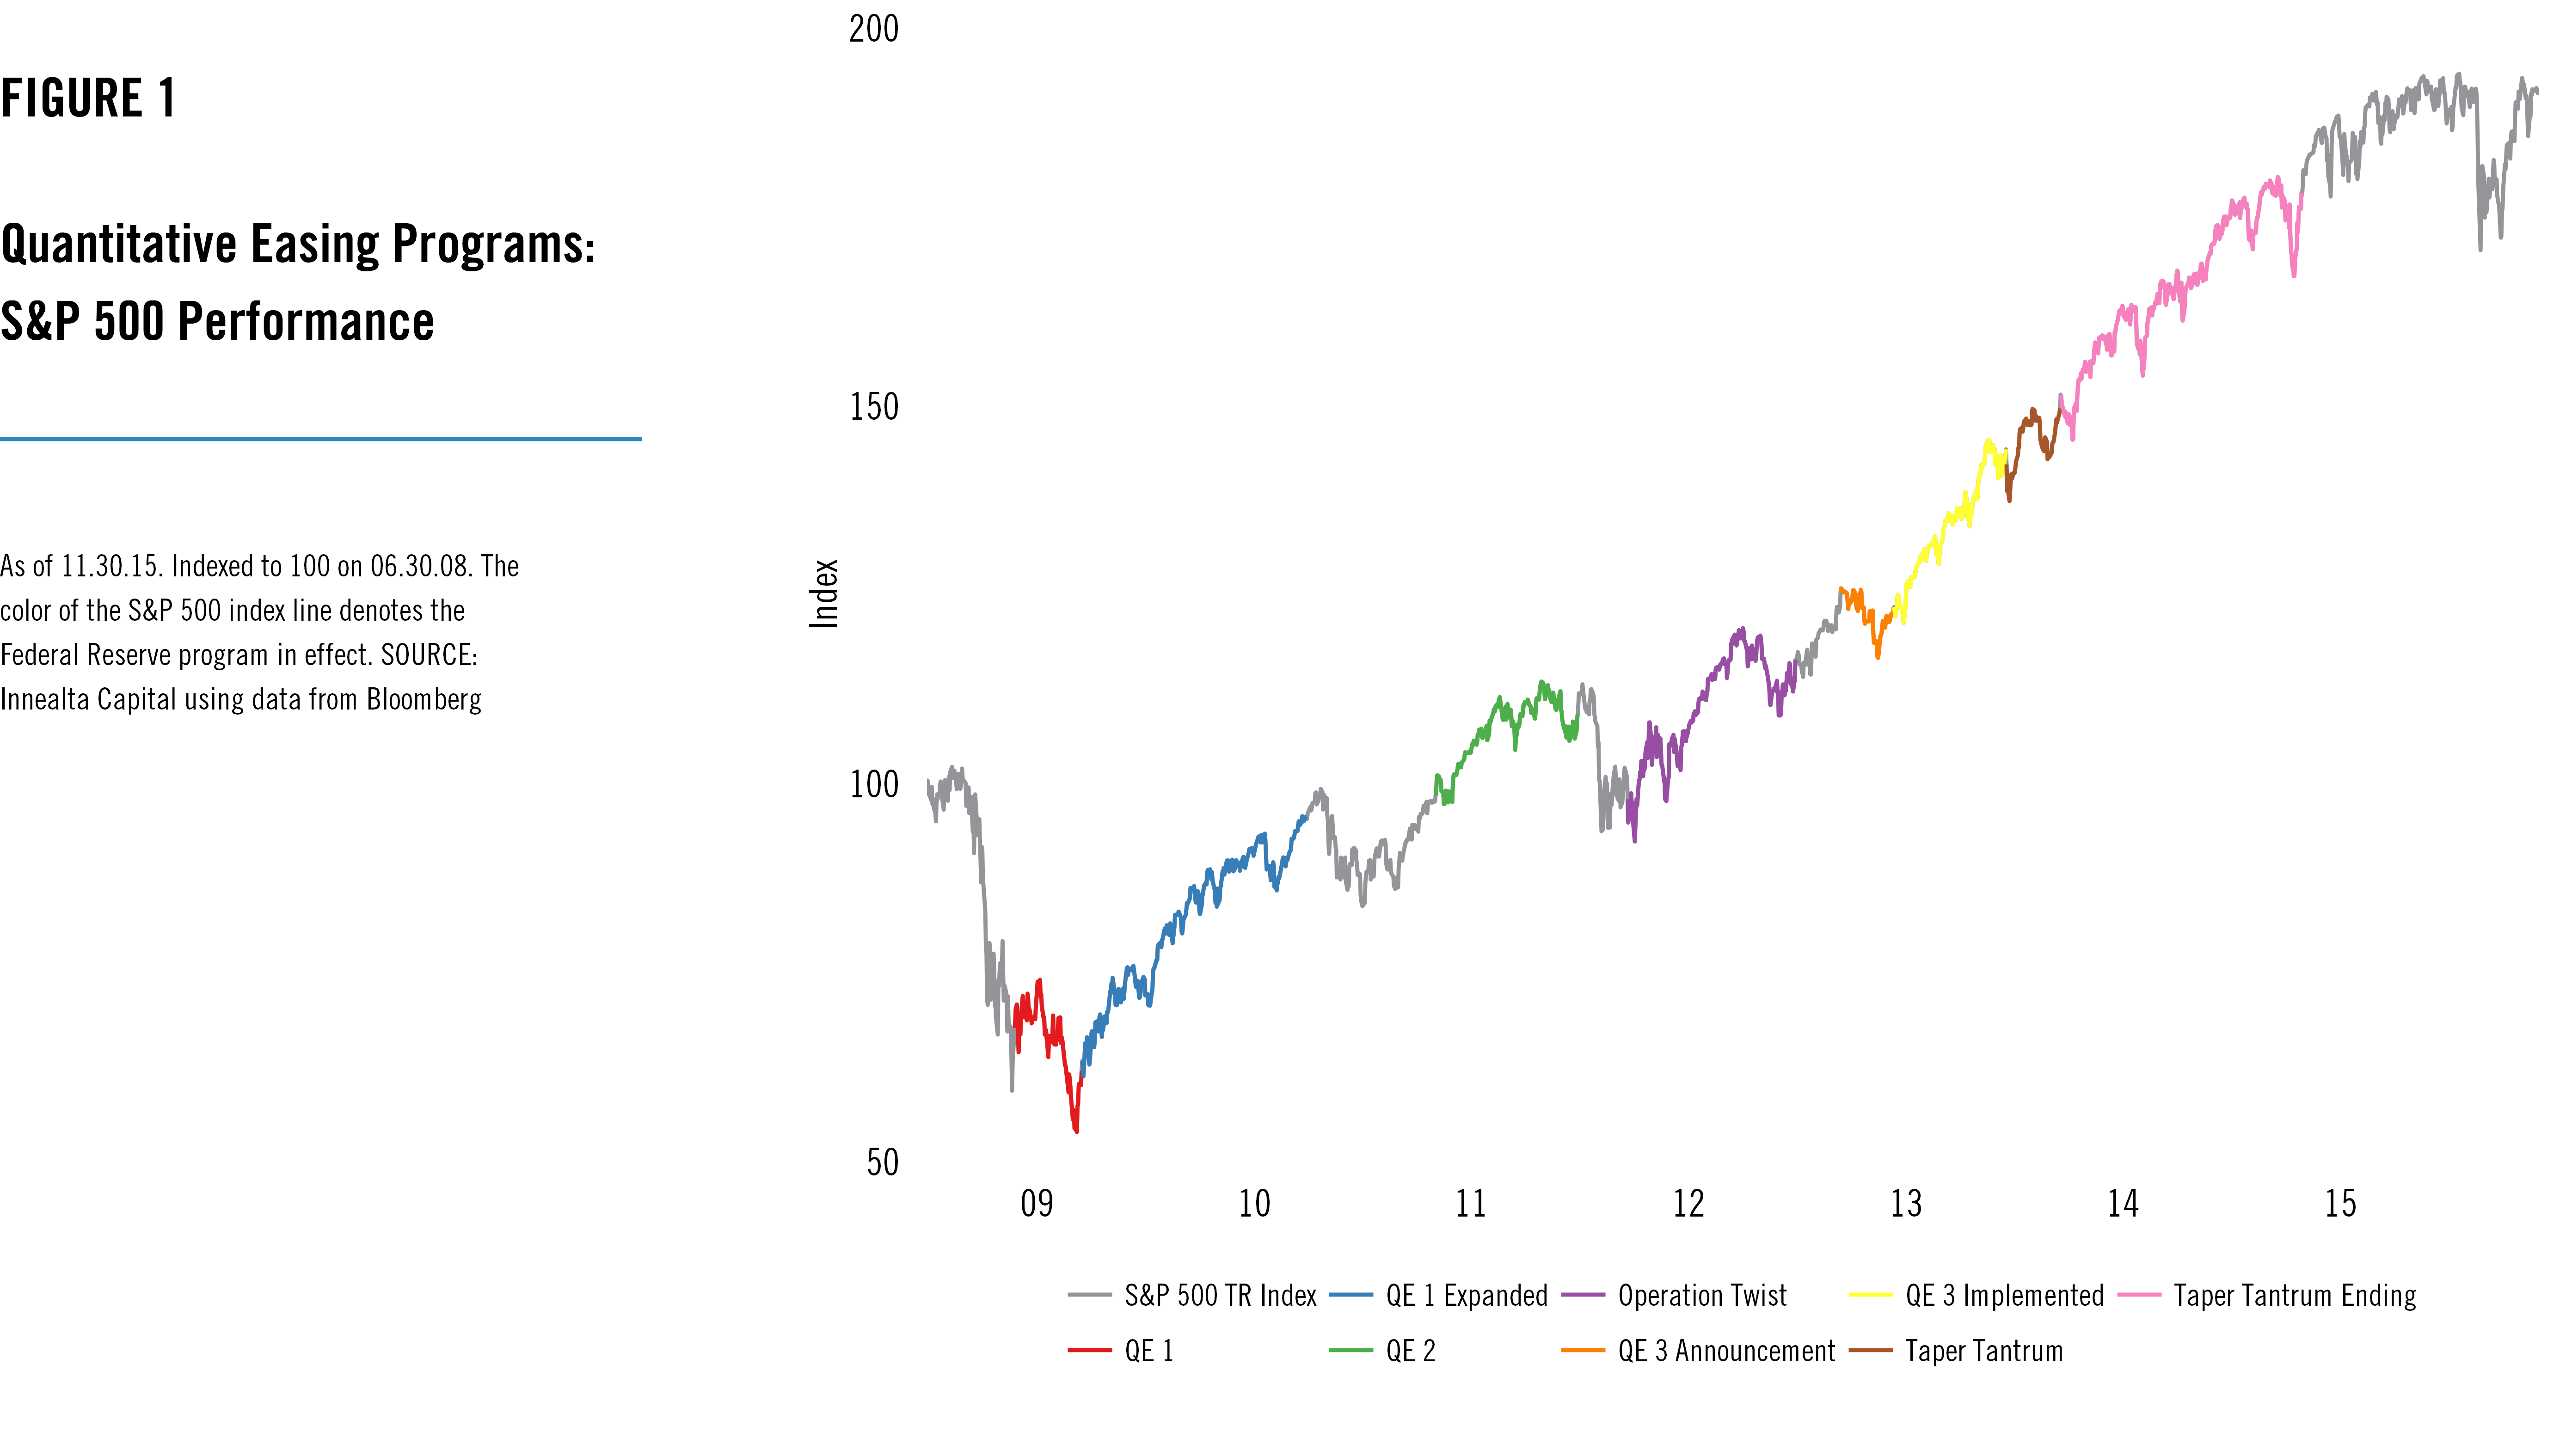
We define a period of rising rates as an increase in the U.S. Federal Funds Effective Rate of 1.25%, or more, over at least a 12 month period. Similarly, falling rate environments are defined as a 1.25%, or larger, decline in the Effective Fed Funds Rate over at least 12 months. Figure 2 identifies periods of rising domestic interest rates since 1970. Here we notice a few trends. Most notably, the Effective Rate has been butting up against the 0% lower bound since 2009; a first in the more than four decades of history. When considering Figure 1 and Figure 2 together, the FOMC policy seems to have been a success from a domestic market performance perspective, but the Fed’s tools may have limited effectiveness should markets encounter headwinds in the near term.
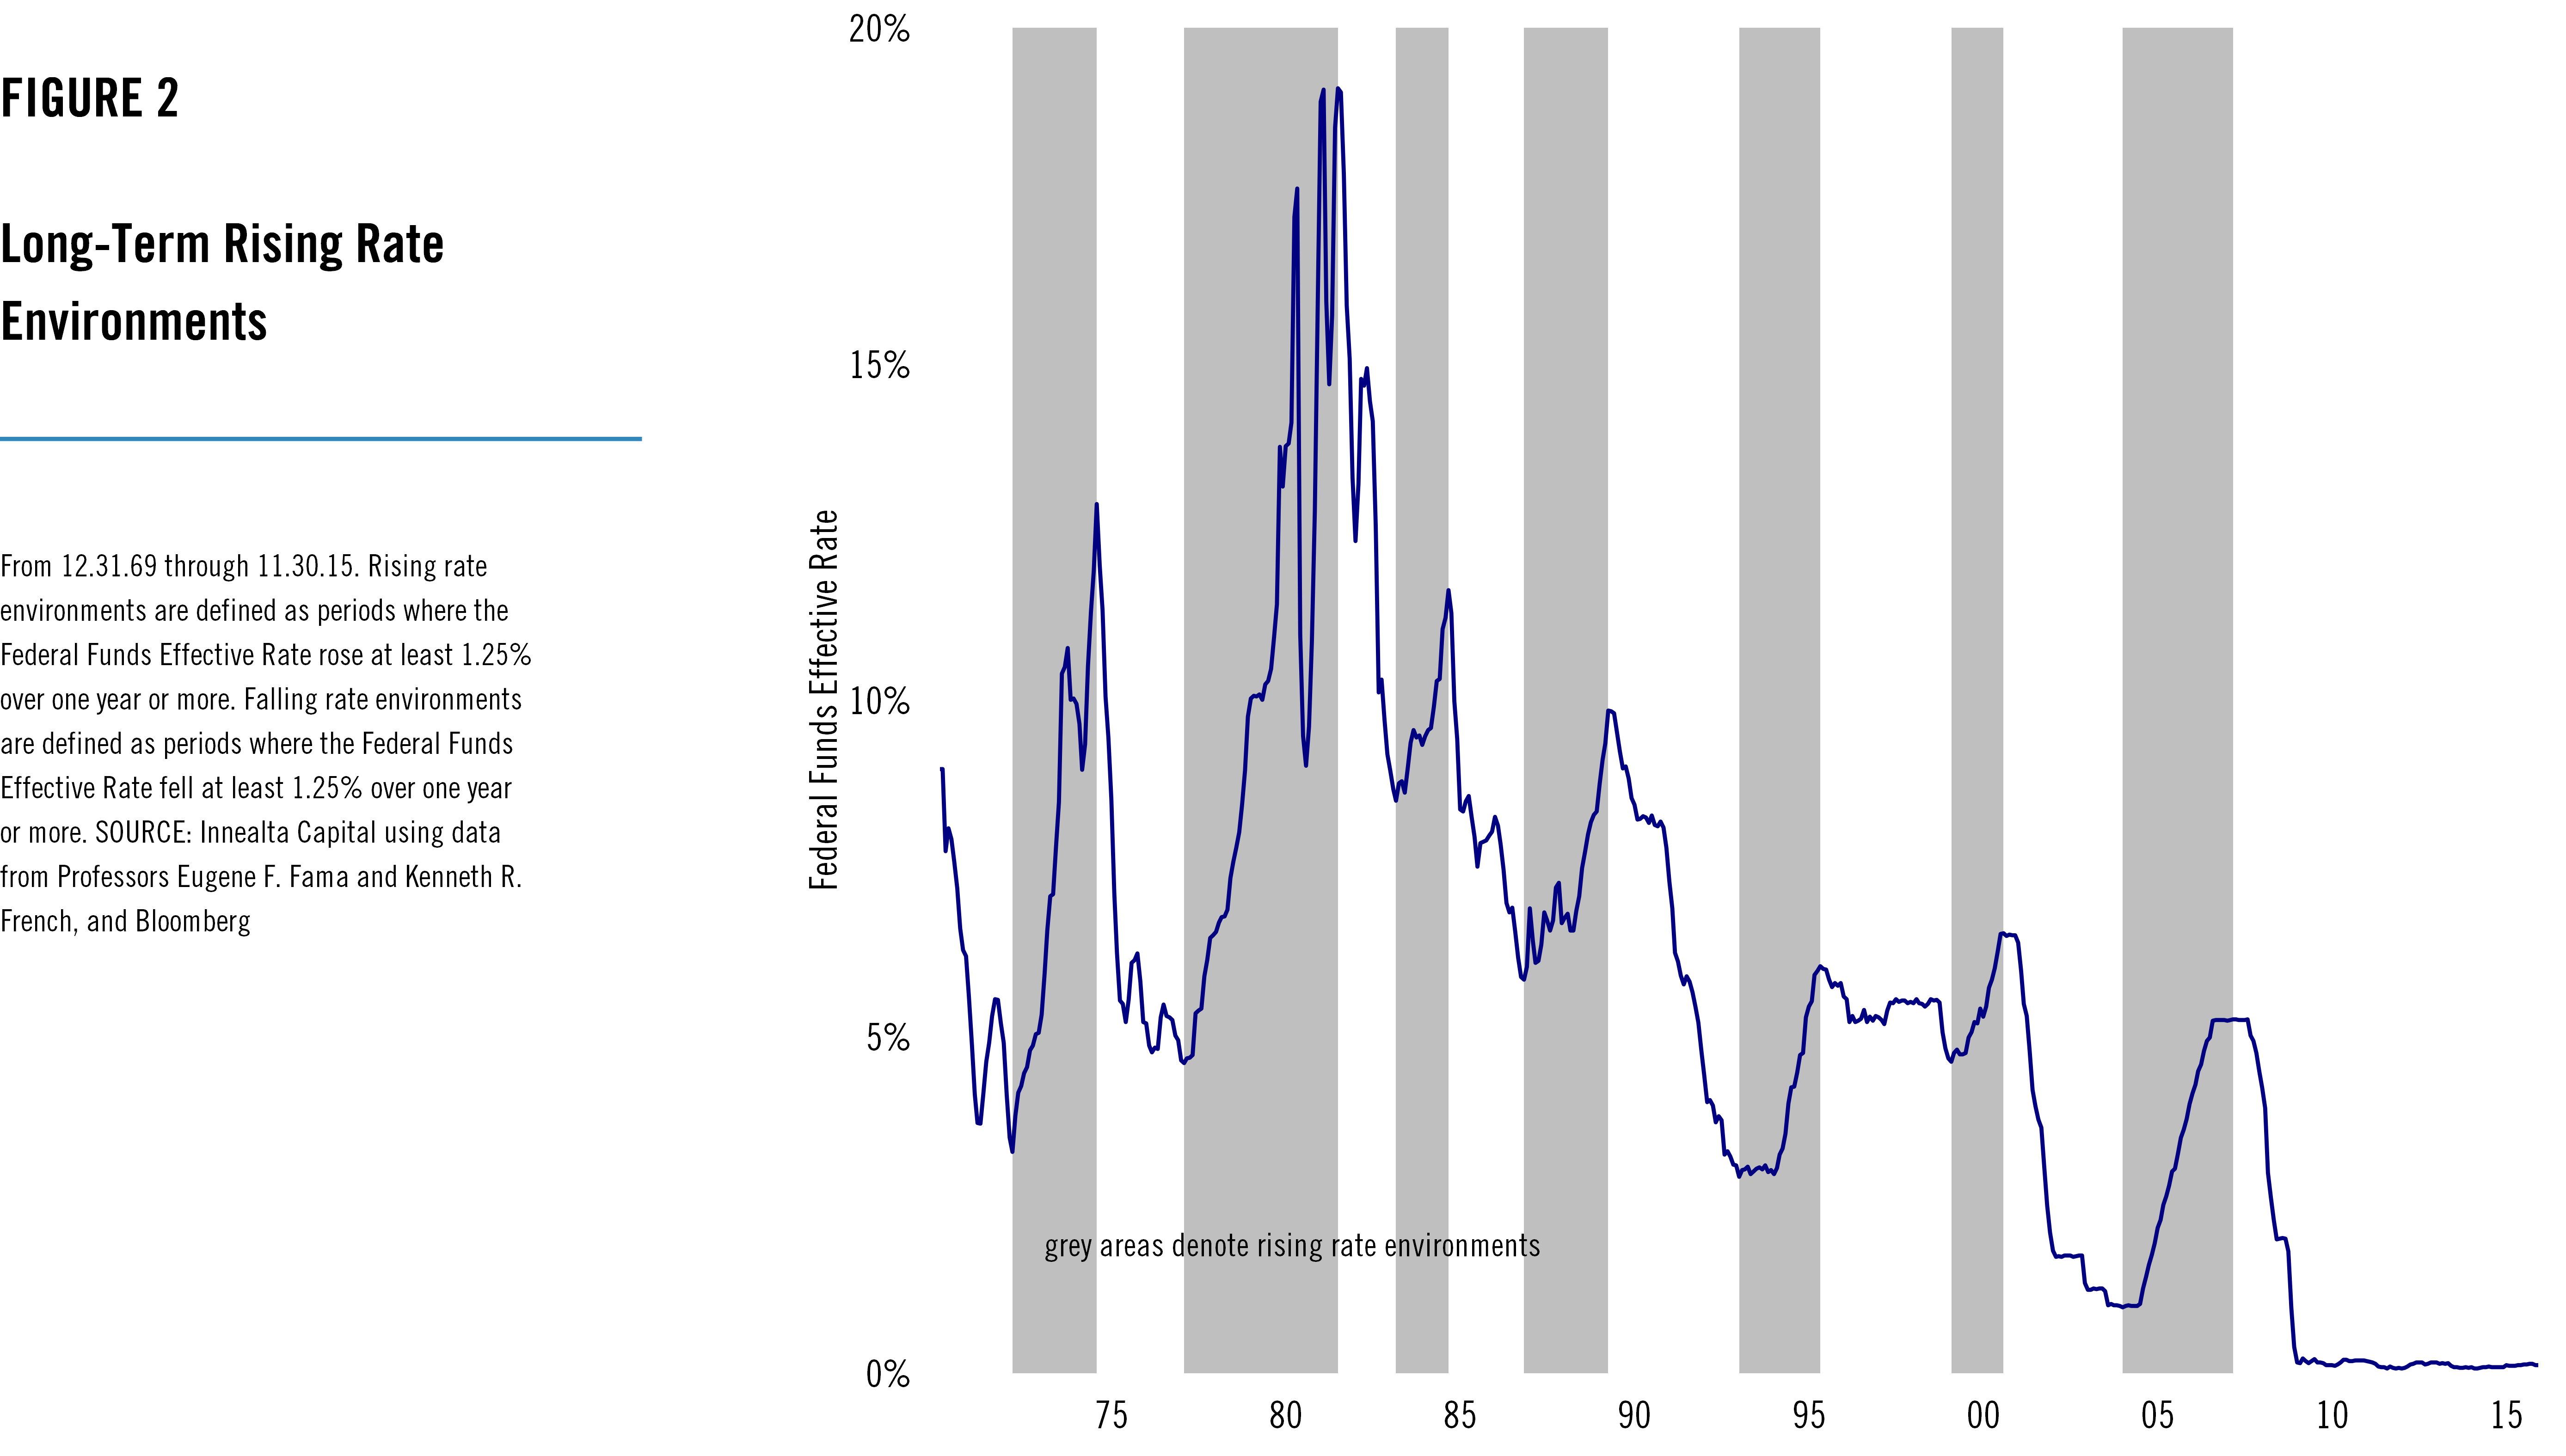
Now that we have identified periods of rising interest rates, we can examine the equity performance across different environments. In Figures 3 and 4, we indexed returns at the beginning of each rising and falling rate period to 100, and observe that broad-market domestic and international returns vary substantially depending on the direction of the Federal Funds Effective Rate.