Headline news on Friday was that oil dropped below $40 per barrel, the lowest since March 3, 2009. It’s bad news for an oil investor to learn 6 1/2 years are wiped out – that is no gain since the bottom of the financial crisis.
Unfortunately, the reality is so much worse than that. The price per barrel of oil is an unrealistic measure for most investors since the oil needs to be stored and that can be costly. Futures contracts are priced to include the storage costs, so according to the theory of storage equation, one is indifferent between buying an oil futures contract or buying physical oil and storing it until the time of expiration of the contract. Needless to say, storing at least 1000 barrels of oil is inconvenient, so most investors prefer futures. Sometimes, returns of futures contracts are more profitable than the spot returns and at other times futures lose more than the spot market. Inventories drive the difference where excess inventory that is expensive to store is losing to a futures investor from a curve condition called contango. The opposite condition, called backwardation, is profitable and happens when there is a shortage so there is no value to storage, and a premium, called convenience yield, is put on owning the commodity immediately.
Obviously right now there is excess oil inventory, but how much is being lost from the term structure of futures as described by the theory of storage equation? It might be more than you think. The answer is shown graphically below where the S&P GSCI Crude Oil Total Return includes the term structure costs from rolling but the S&P GSCI Crude Oil does not. With a quick glance, it is clear that 10 additional years of returns are wiped out from these costs.
At Friday’s close, the S&P GSCI Crude Oil index was at 221.69, the lowest since 3/2/2009 when the level was at 220.05, and it fell 62.1% since its high on June 20, 2014. However, the S&P GSCI Crude Oil Total Return fell 66.3% from its June high to a level of 516.55, its lowest since Oct. 11, 1999 when the index was 508.38. Four percent may not seem like much, and although the difference is small from the backwardation that was present through Nov, 2014 (as shown in the chart below,) again, it is enough to erase an additional 10 years of returns.
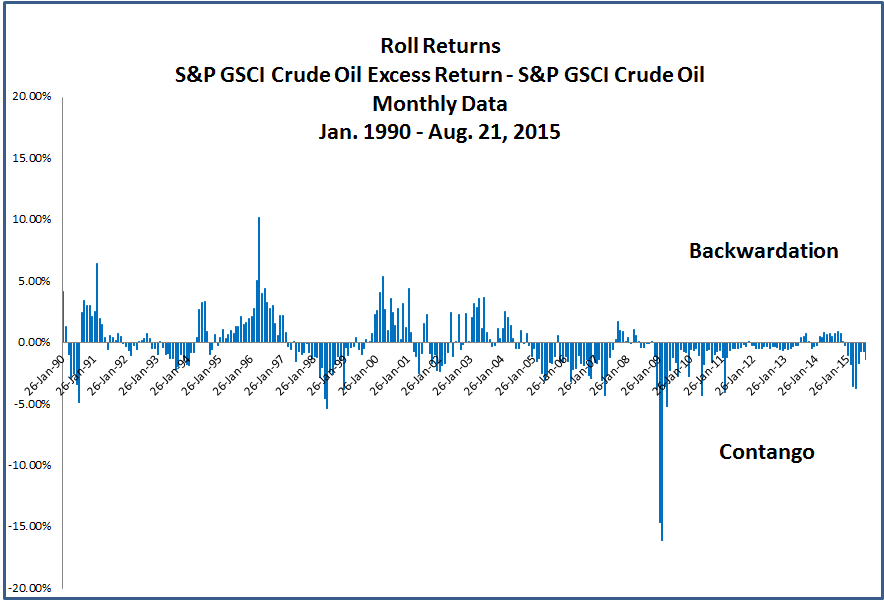
Two things are interesting. One is that the current rolling costs are currently only about half of what was observed in the drawdown from July 14, 2008 to Feb. 18, 2009. The other interesting observation is that the huge negative rolling costs don’t exactly correlate with the timing of the drawdowns. It was really in Jan and Feb of 2009, that the roll cost spiked with a 33.5% loss in the total return versus a 10.0% loss in the spot return. It took the inventories over 4 years to deplete with no significant shortage for roughly 6 years as shown in the chart below: