Entering Tuesday, nine of the top 10 non-leveraged exchange traded funds on a year-to-date basis were China ETFs. The outlier, the Guggenheim Solar ETF (NYSEArca: TAN), also features significant China exposure.
However, Tuesday was a dismal day for China ETFs after the Shanghai Composite endured its largest one-day loss in nearly four months while Hong Kong’s Hang Seng Index slipped to its lowest levels in two weeks. Yesterday, nine of the 10 worst-performing ETFs were China funds and six of those offenders were A-shares ETFs, funds tracking the stocks trading on the mainland exchanges in Shanghai and Shenzhen. [Bearish Bets on A-Shares ETF Rise]
China ETF investors, particularly those holdings A-shares funds such as the Deutsche X-trackers Harvest CSI 300 China A-Shares Fund (NYSEArca: ASHR), KraneShares Bosera MSCI China A ETF (NYSEArca: KBA), Market Vectors ChinaAMC A-Share ETF (NYSEArca: PEK) and ASHR’s small-cap equivalent, the Deutsche X-trackers Harvest CSI 500 China A-Shares Small Cap Fund (NYSEArca: ASHS), might do well to closely examine the current state of affairs with the Shanghai Composite’s chart.
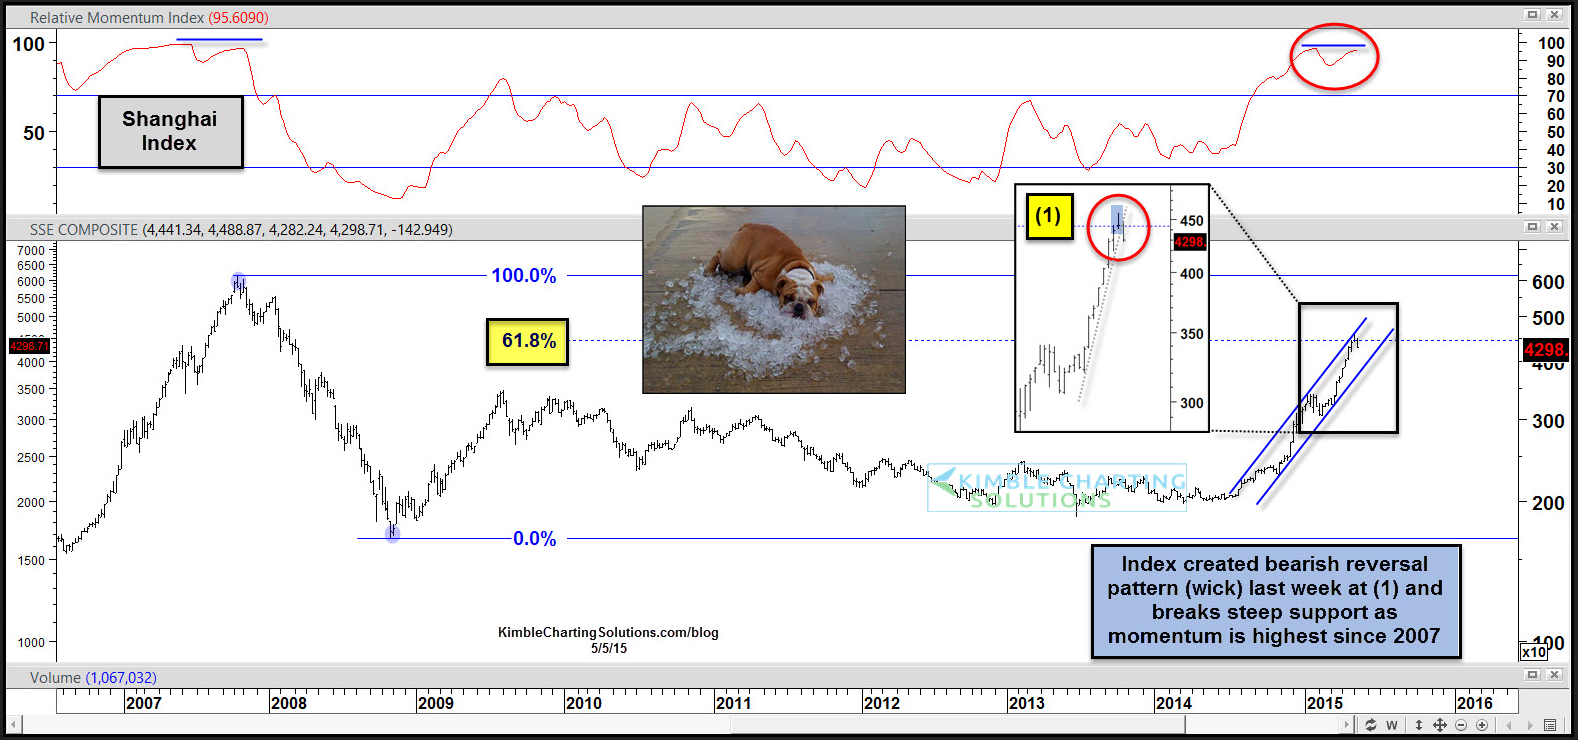
“The Shanghai Stock Market has been the hottest of the hot over the past year, up over 110%, which dwarfs the returns of the S&P 500 and Germany’s DAX index,” said Chris Kimble of Kimble Charting Solutions. “The rally over the past year put the Shanghai index at its 61% retracement level based upon the 2007 highs and 2008 lows. As the index was hitting this Fibonacci extension level, it created a reversal pattern (wick) last week. As it was hitting this Fibonacci resistance level, momentum was reaching overbought levels only seen at the 2007 highs.”
Chart Courtesy: Kimble Charting Solutions