In this prolonged low interest rate environment, the S&P U.S. Preferred Stock Index has performed well, returning 2.92% year-to-date. Meanwhile, the S&P 500 (TR) is up a modest 0.6% and long term bonds tracked in the S&P/BGCantor 20+ Year U.S. Treasury Bond Index are up 4.53% in total return. So far, the preferred stock market with characteristics of both equities and bonds has performed as expected – somewhere in the middle of the performance of stocks and long term bonds.
Select Indices: Year to Date Performance (March 27, 2015):
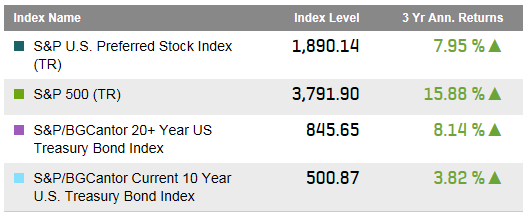
Over a three year period, the annualized returns of the U.S. preferred market have been more bond like than equity like. The S&P U.S. Preferred Stock Index had a three year annualized return of 7.95% while long U.S. Treasury bonds have returned 8.14%. Meanwhile, the three year annualized return of the S&P 500 has been well over 15%.
Select Indices: Three Year Performance (March 27, 2015):