Six months ago, commodities looked like they were on the brink of a comeback. The S&P GSCI Total Return gained 7.4% YTD through June 20 at its high. Back then, almost a record number of commodities, 12, were in backwardation, reflecting shortages in Brent Crude, Cocoa, Copper, Corn, Cotton, WTI Crude Oil, Feeder Cattle, Gold, Live Cattle, Natural Gas, Soybeans and Unleaded Gasoline.
Now, the S&P GSCI TR has lost 1/3 of its value, mostly coming from oil since taken together WTI and Brent make up about 40% of the index with a total of 62% in the energy sector. Energy is down 42.8% from its high in June, and at first it seemed the other sectors were sliding with it. Notice in the table below that in the S&P GSCI TR, all the sectors posted losses from June 20 through most of the summer, with precious metals ending its losing streak just in November.
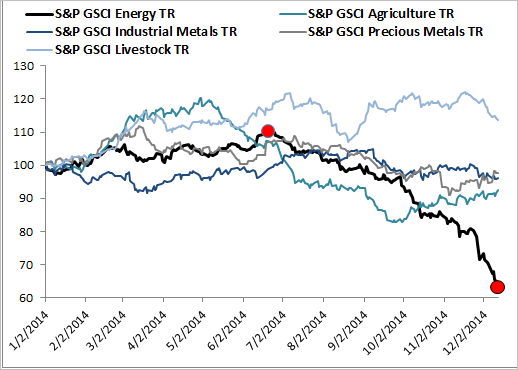
At some point the oil price slide decoupled from the other commodities since their fundamentals are different. From their respective bottoms, agriculture gained 11.8%, precious metals gained 7.3%, livestock gained 6.0% and industrials metals have been flat, gaining 60 basis points. Nothing is overpowering Saudi’s oil supply in energy, but now energy seems to be on its own. Below is the graph of the sector performance where energy’s lonely dropoff is clear.