There are all types of whacky effects and indicators in financial markets. Whacky may be understating the matter, but uncannily accurate also applies.
The “Hollywood Indicator” has been getting press because U.S. stocks have struggled since the release of “The Wolf of Wall Street,” though it has been noted, that indicator seems to gloss over “Trading Places,” which preceded the start of one of the best bull markets when it was released in the early 1980s.
Getting down to business, there is another indicator that has not gotten much hype though it is alarmingly accurate. We will dub it the “Inverse ETF Reverse Split Indicator.” Reverse splits are common among leveraged ETFs and following a sustained bull run for stocks, such as the one seen last year, it is not unusual for issuers of inverse ETFs to need to engineer some reverse splits to inflate share prices.
Earlier this month, ProShares, the largest issuer of inverse and leveraged ETFs, announced reverse splits for 17 inverse products. That announcement was made on Friday Jan. 10. Since Monday Jan. 13, the S&P 500 is off more than 2%.
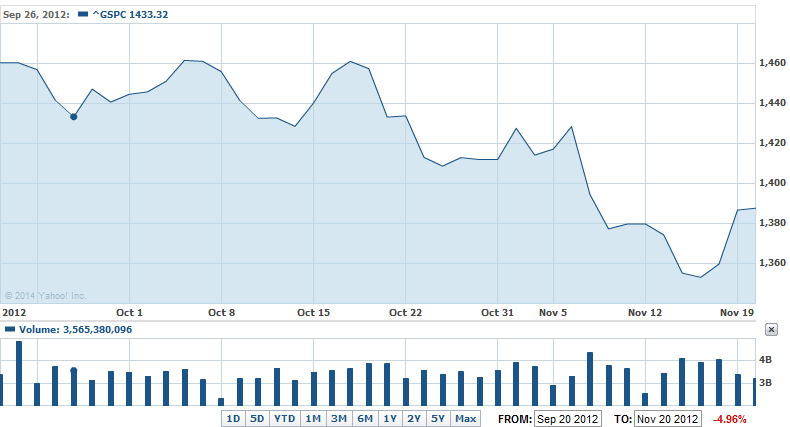
Think that is a coincidence? Think again. In September 2012, ProShares announced reverse splits for nine ETFs, including broader market funds such as the UltraShort S&P500 ProShares (NYSEArca: SDS) and the ProShares UltraPro Short Dow30 (NYSEArca: SDOW).
Over the following two months, the S&P 500 looked like this: