On the back of a market rally and increased investor interest in minimum volatility strategies, I have been getting a lot of questions on whether those strategies now appear expensive compared with a standard capitalization-weighted portfolio.
In short, clients are asking if minimum volatility has been “overbought” and is not likely to be effective going forward. My response is that while at first glance the answer would seem to be “yes,” a deeper analysis shows the answer is actually “no.” But more importantly than that, it’s important for clients to realize that minimum volatility should not be thought of as a “market timing” strategy. Let me explain. [Low-Volatility ETF Cools as ‘Junk’ Stocks Soar]
As of May 28th the valuation [1] for the MSCI USA Minimum Volatility Index was 8.62x while the MSCI US Index – the comparable cap-weighted index – was 8.16. Based on this metric alone, investors may conclude that exposure to the minimum volatility strategy is “expensive” compared with a typical capitalization-weighted investment and thus potentially not attractive.
This is, however, not the whole story. Valuations will vary across investments when the underlying fundamentals justify reasonable valuation differences. In other words, differences in valuation could be justified by differences in fundamentals of the underlying companies, such as profitability or balance sheet strength. These distinctions are particularly important at the aggregate level where diversified strategies or baskets will “wash out” individual company-level differences and will tend to reflect broad fundamental characteristics of the underlying investments.
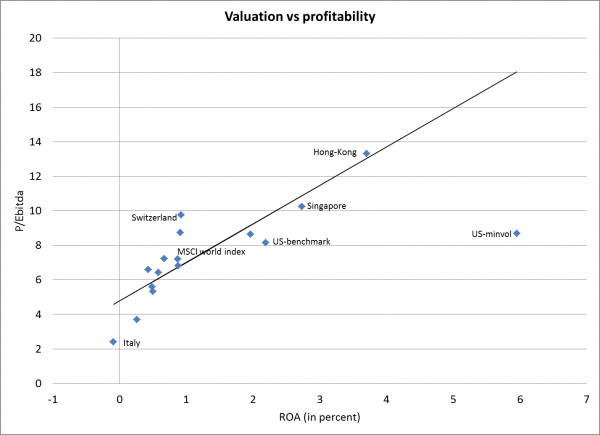
In the case of minimum volatility, profitability is one of those differences. To illustrate, the chart below shows the profitability (measured as Return-on-Assets) as well as the valuations (measured as Price-to-EBITDA) across a range of developed countries [2] as of the end of April. Close to 75% of the variation in valuation can be explained just by looking at the aggregate profitability level, with every percentage point in additional profitability explaining about 2 points worth of additional valuation. The US cap-weighted benchmark is on the “expensive” side with a valuation ration of 8.16x but this is partly explained by profitability levels higher than that of the average developed country.
The chart also shows that the minimum volatility index is indeed more expensive than the benchmark, but the aggregate profitability of the portfolio of companies in the minimum volatility index is also higher than the benchmark. Indeed, the minimum volatility exposure seems better valued in the sense that its higher profitability would justify higher valuations given the observed relationship between valuations and profitability across developed countries.