In a recent blog we detailed our bullish views on emerging markets generally, given the attractive prices we were seeing in the region and how a historical analysis showed a favorable return environment following similar price points in history.
In this piece, we take a deeper dive into a very similar analysis by focusing specifically on Asian stocks. Asian equities, defined in this piece as the MSCI AC Asia Pacific ex Japan Index, have outperformed EM equities, defined here as the MSCI Emerging Markets Index, by nearly 9% over the last 12 months (as of 2/28/13).
We look at historical valuations of Asian equities, and our conclusion is that Asian equities, like the emerging markets overall, are currently selling at relatively low valuations based on historical ranges—and we found these current valuations to be a “sweet spot” for historical 12-month forward returns, as we will detail in the analysis below.
Where Has This “Historically Sweet Spot” Been?
Based on the last 24 full calendar years of data available for Asian equities, we have created three subsets, each with eight component years:
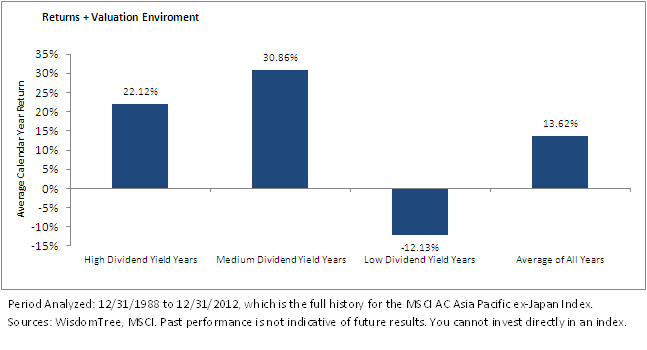
- High Dividend Yield Years: These comprise the years following the top eight trailing 12-month year-end dividend yields. The highest was 5.60% (12/31/2008), while the lowest was 3.30% (12/31/2005).
- Medium Dividend Yield Years: These comprise the years following the middle eight trailing 12-month year-end dividend yields. The highest was 3.26% (12/31/1992), while the lowest was 2.54% (12/31/2010). As we’ll see, this has been the “historically sweet spot.”
- Low Dividend Yield Years: These comprise the years following the lowest eight trailing 12-month year-end dividend yields. The highest was 2.52% (12/31/2007), while the lowest was 1.69% (12/31/1999).
The crucial question we ask is: Were there noticeable differences in average 12-month forward returns following High, Medium or Low Dividend Yield Years, and did these tend to be above or below the average for all 24 years?
Medium Dividend Yield Years Indicate a Potential “Sweet Spot”
Connecting the Current Period to the Historical Analysis
- 2/28/2013: As of this date, Asian equities had a trailing 12-month dividend yield of 2.85%, placing it squarely among the “Medium Dividend Yield Years.”
- Sweet Spot for Returns: The highest average actually corresponded to the performance of Asian equities during medium dividend yield years: 30.86%, which is more than 17% ahead of the average for all years. This is the range we refer to in the title of this piece—the “sweet spot” for valuations.
- Signaling Potential: During the High or Medium Dividend Yield Years, only four of the 16 periods exhibited losses, and the worst return was approximately -16%. The picture looks drastically different for the Low Dividend Yield Years: Five out of eight years saw negative returns, the worst being nearly -52%.
While certainly a valuable illustration of the point—namely that there has been an association between relatively higher or lower trailing 12-month dividend yields and subsequent higher or lower returns in the past—this may not always be the case and should not be viewed as an exact science.
Jeremy Schwartz is director of research at WisdomTree Investments (NasdaqGM: WETF). This post was republished with permission from the WisdomTree blog.