Much has been written about today’s prolonged low interest rate environment and how it has prompted many investors to seek out riskier assets in an attempt to generate a return that exceeds inflation. One big beneficiary of this trend has been high yield. This year through the end of September, $38 billion has flowed into high yield mutual funds and ETFs.
Most investors are aware that high yield bonds have greater credit risk than many other fixed income sectors. But what might be less appreciated – especially by investors who are new to high yield — is how challenging high yield liquidity can be at times, and how rapidly high yield bond prices can fall in a deteriorating market. [High-Yield ETFs Getting Junkier?]
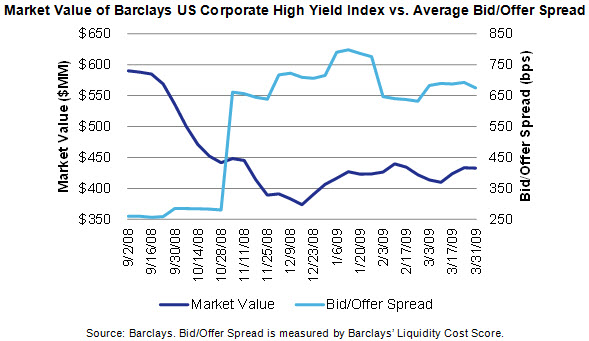
Take a look at the chart below. It’s a six-month snapshot of the 2008 financial crisis, and it illustrates how bid/offer spreads on high yield bonds may widen as the market deteriorates. The dark blue line shows the market value of the Barclays US Corporate High Yield Index. The light blue line shows the average bid/offer spread of bonds in the high yield market. Notice how the market sell-off was accompanied by rising transaction costs for high yield securities.
Investors also need to understand the high yield market’s “equity-like” characteristics. For instance, when high yield sells off, it tends to do so in a “risk-off” market in which other higher risk investments, like equities, are also selling off. This drop in value during a stock market decline can be an unwanted surprise for investors who expect the bond portion of their portfolio to rise in value during a risk-off market and to help shelter the overall portfolio from the impact of a market dislocation.
