Looking at inter-market relationships, and trying to see if there is a consistent message across and within asset classes is extremely important for investors. Since early June I’ve published several articles discussing the possibility of a Summer Crash of 2011 (aka the Great Re-Adjustment).
ETFs are great for this purpose since they provide a quick and easy way to look at what various averages are doing.
Earlier this week I wrote one could use the small-cap iShares Russell 2000 (NYSEArca: IWM) to get a sense for if the market was embracing or shunning risk. [Using Small-Cap ETF Relative Performance to Measure Risk]
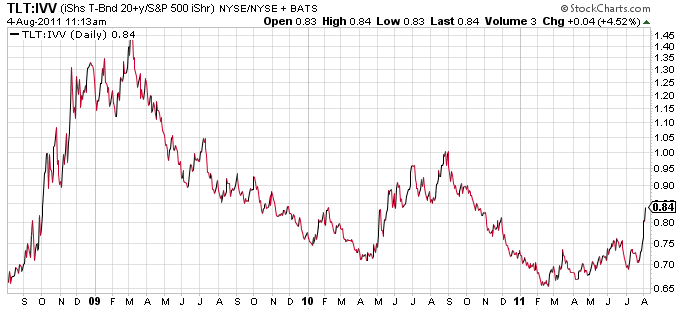
Another way to see how markets are behaving is to look at the bond/stock price ratio.
Take a look below at the iShares Treasury Bond 20+ Year (NYSEArca: TLT) relative to the SPDR S&P 500 ETF (NYSEArca: SPY). As a reminder, a rising price ratio means the numerator/TLT is outperforming (up more/down less) the denominator/SPY.
Chart source: StockCharts.com.
The ratio has risen substantially in recent days, but may have much further to run as the denominator (S&P 500/SPY) shrinks. I think there is a strong likelihood that the ratio could very quickly adjust to around 1. This is the ratio level hit right before QE2 began in September. I use this level because Treasury rates on an absolute basis are pretty much at the same levels they were before the stock market rally began. All else being equal then, stocks probably have to be at those levels too.
With Europe effectively going through a rolling crash, the U.S. may be next in line. There is currently no stimulus in sight anywhere in the world, and with global government austerity, and the possibility of a Lehman-like scenario in Europe, the odds of a sudden and sharp sell-off in risk assets appears to be an ever-increasing possibility.